QueueMetrics suite for Asterisk Wallboard Tutorial

Wallboard creation Tutorial
In this tutorial we will detail in a step to step fashion, how to create a new QueueMetrics’ Wallboard. Since QueueMetrics 17.06 the new Wallboard functionality is available, which allows the user to create, save and edit multiple wallboards to customize their call center monitoring. We will take a look at some of the wallboard editing functionalities by creating a new wallboard, this is achieved by using some of the available monitoring widgets.
Step 1) Open the Wallboard Editing Page.
From the QueueMetrics homepage we can see the last section of the second column is named “Wallboards”. There is where the wallboards we create will be saved. In the first section of the second column instead, we can see the “Start Wallboard” button. Let’s click on it.
Step 2) Last Edited Wallboard.
By clicking on “Start Wallboard” we will open the last wallboard we edited. Let’s create a new one from scratch by pressing on the folder icon on the top right.
Step 3) Wallboards Menu
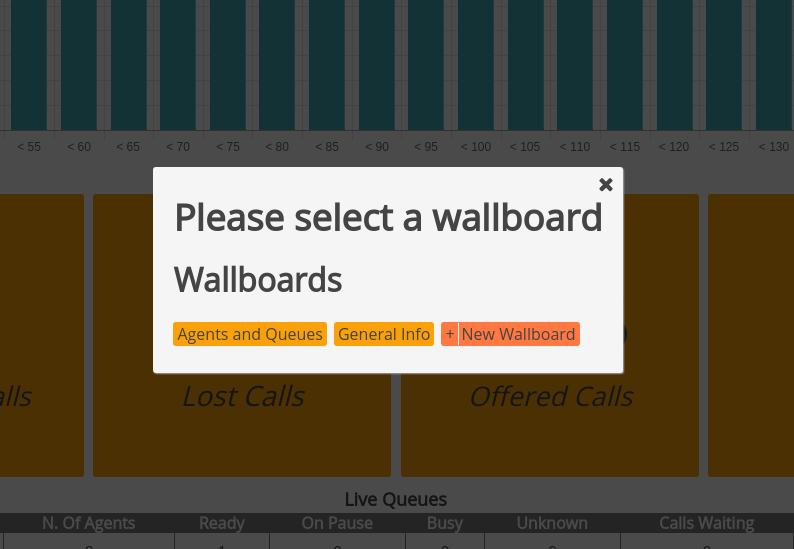
This Icon will open the Wallboards Menu where we can open all the wallboard we created, or create a new one. Let’s click on “New Wallboard”.
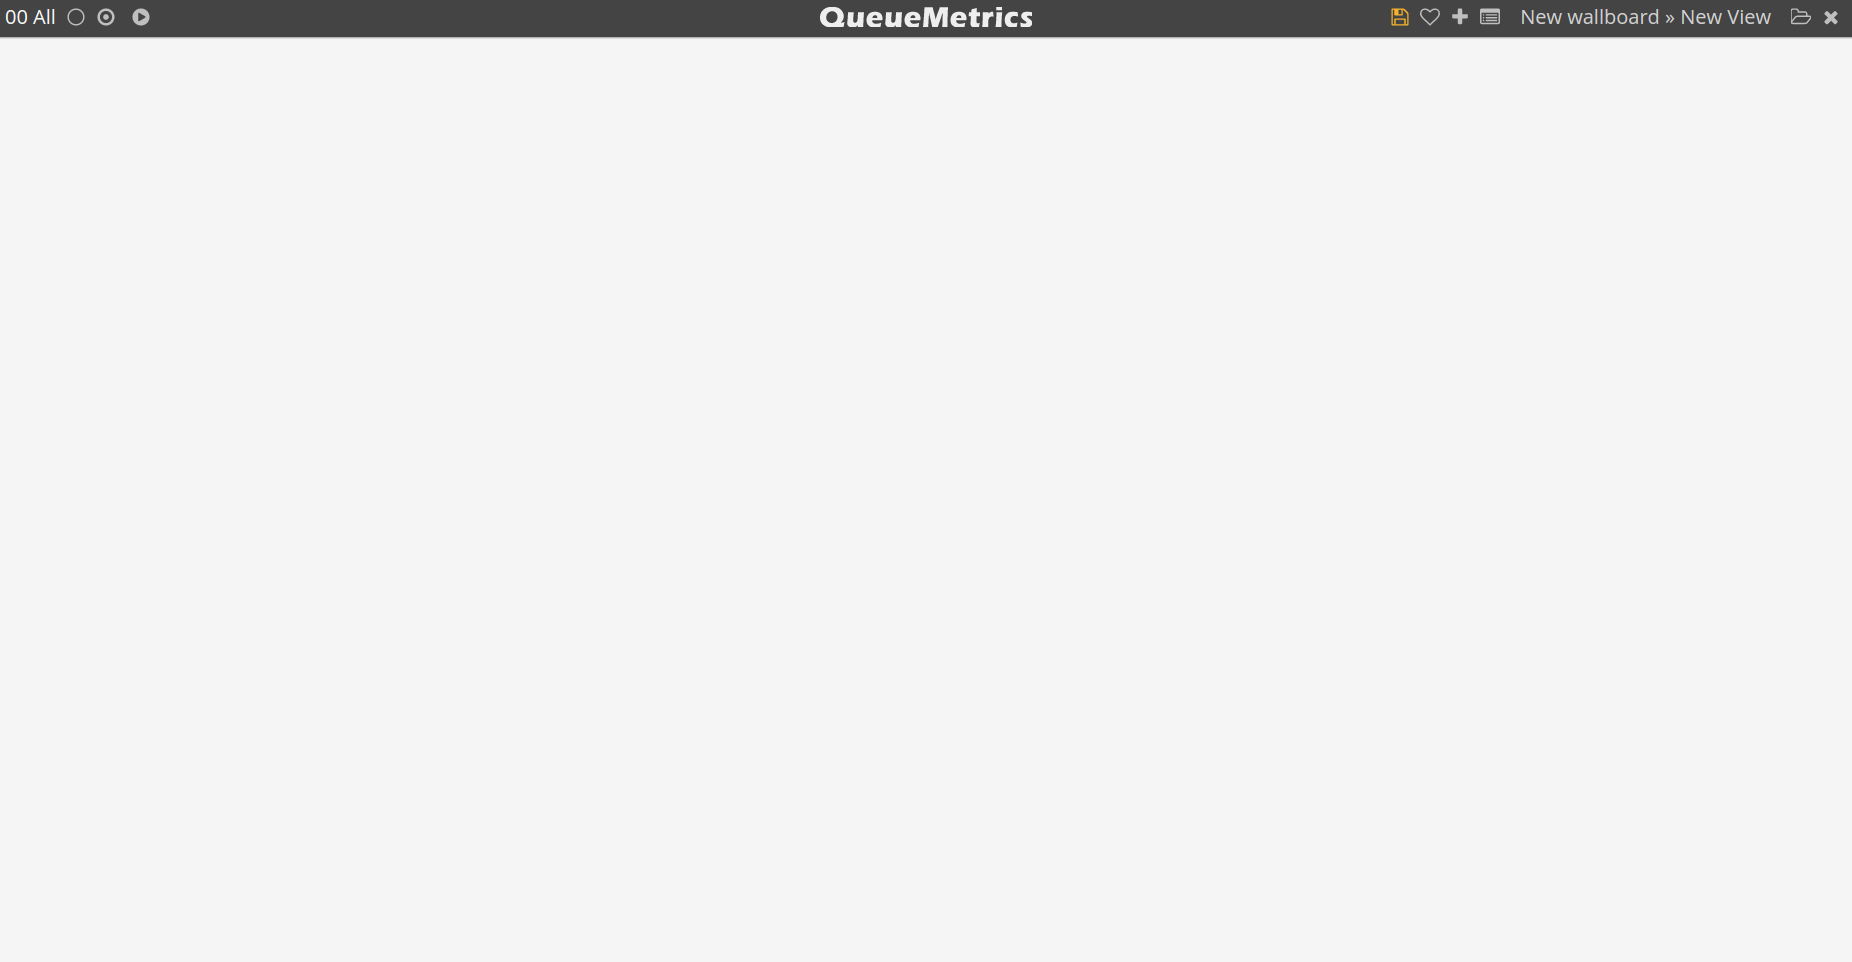
Step 4) Empty Wallboard
![]()
When a new Wallboard is created, it contains a single widget, which indicates the current date and time. This is called the Clock widget. Let’s check our Wallboard configurations before adding other widgets, to do that click on the Wallboard name in the top right of the screen.
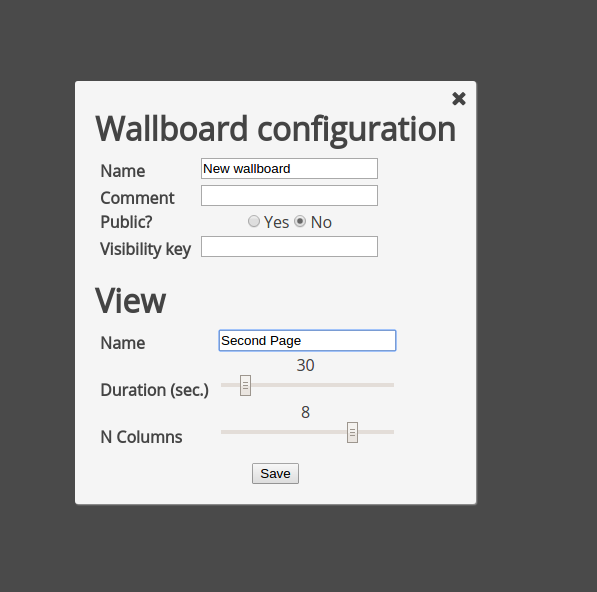
Step 5) Wallboard Configuration
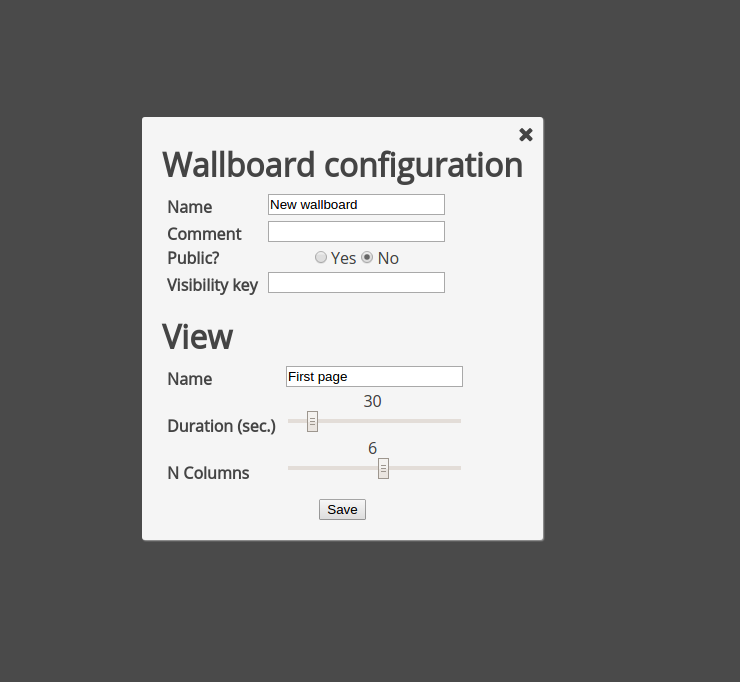
Each Wallboard is composed of different Views. we can think of Views as pages we can sort through. Each Wallboard can be composed of multiple pages and each page can have a duration. If the duration is 20 seconds for example, after 20 seconds the wallboard will switch to the next page and so on. From this menu we can alter the current view’s configuration, together with the wallboard’s name, visibility key and decide if this wallboard should be public or private.
For now let’s just return to the empty wallboard and click on the “plus” icon on the top right of the screen.
Step6) Add a new Widget
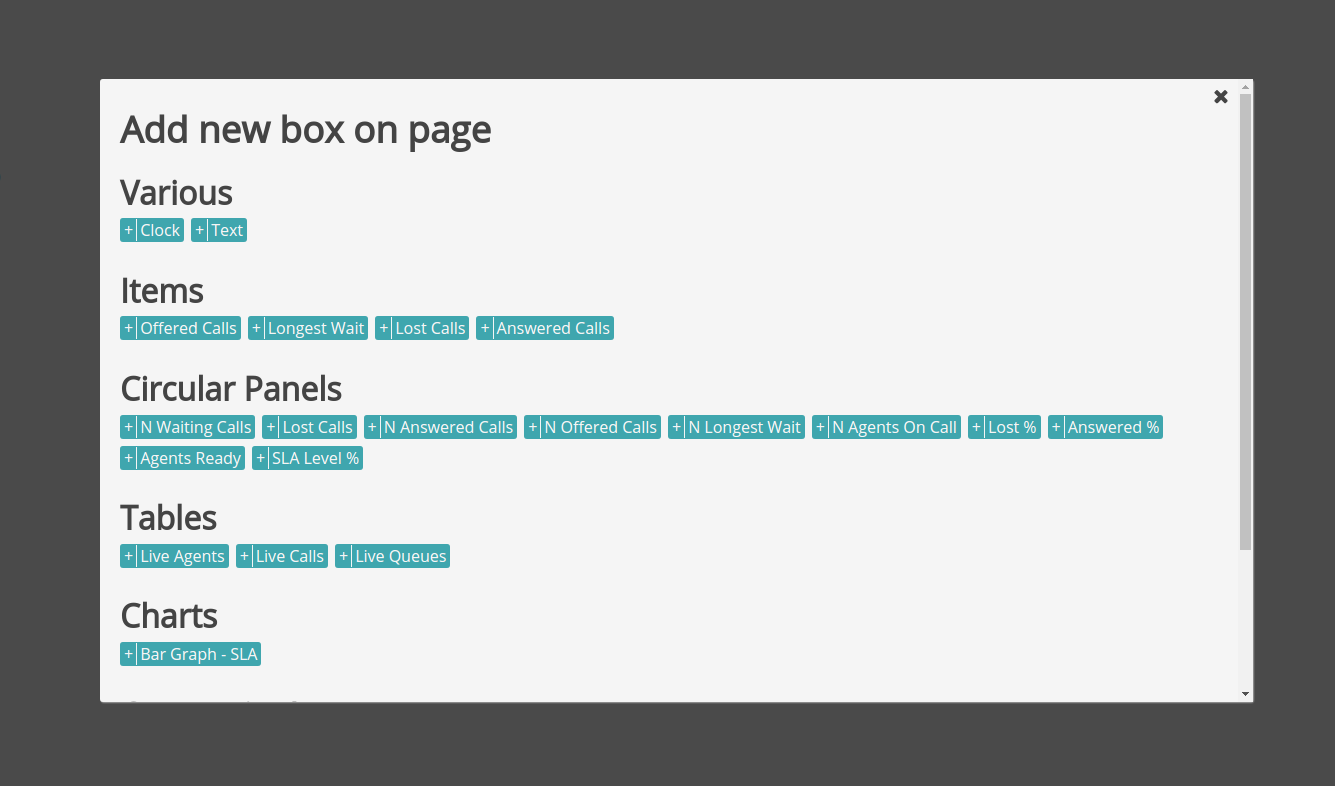
This is the Widget’s menu. From here we can choose different widgets to add to our Wallboard. Widgets are divided in categories, based on their appearance. Let’s choose “N answered calls” from the “Circular Panel” category.
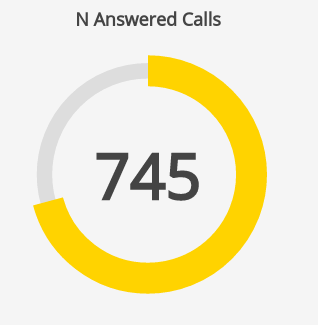
Step7) Answered Calls
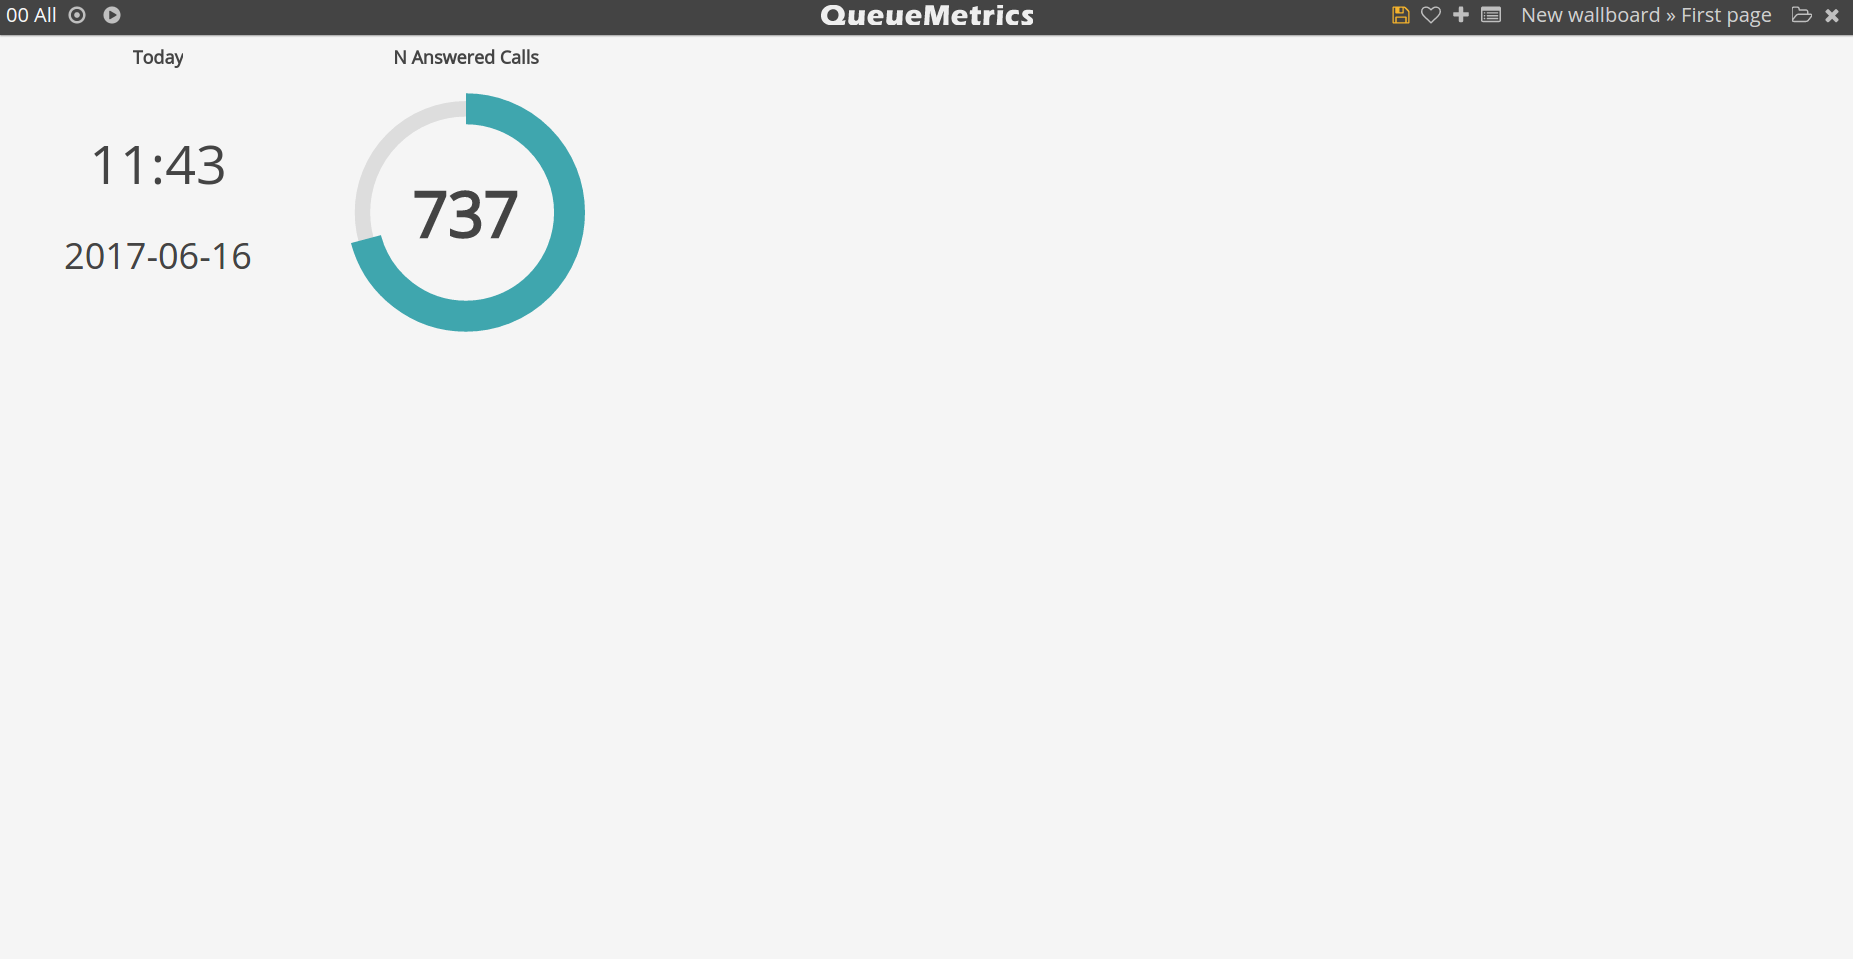
As we can see the widget is now on our Wallboard. This Widget shows the number of Answered calls on the selected queues. the circle is not completely filled because it represents the percentage of answered calls among the total calls that were offered to the queue.
Step8) Save the Wallboard
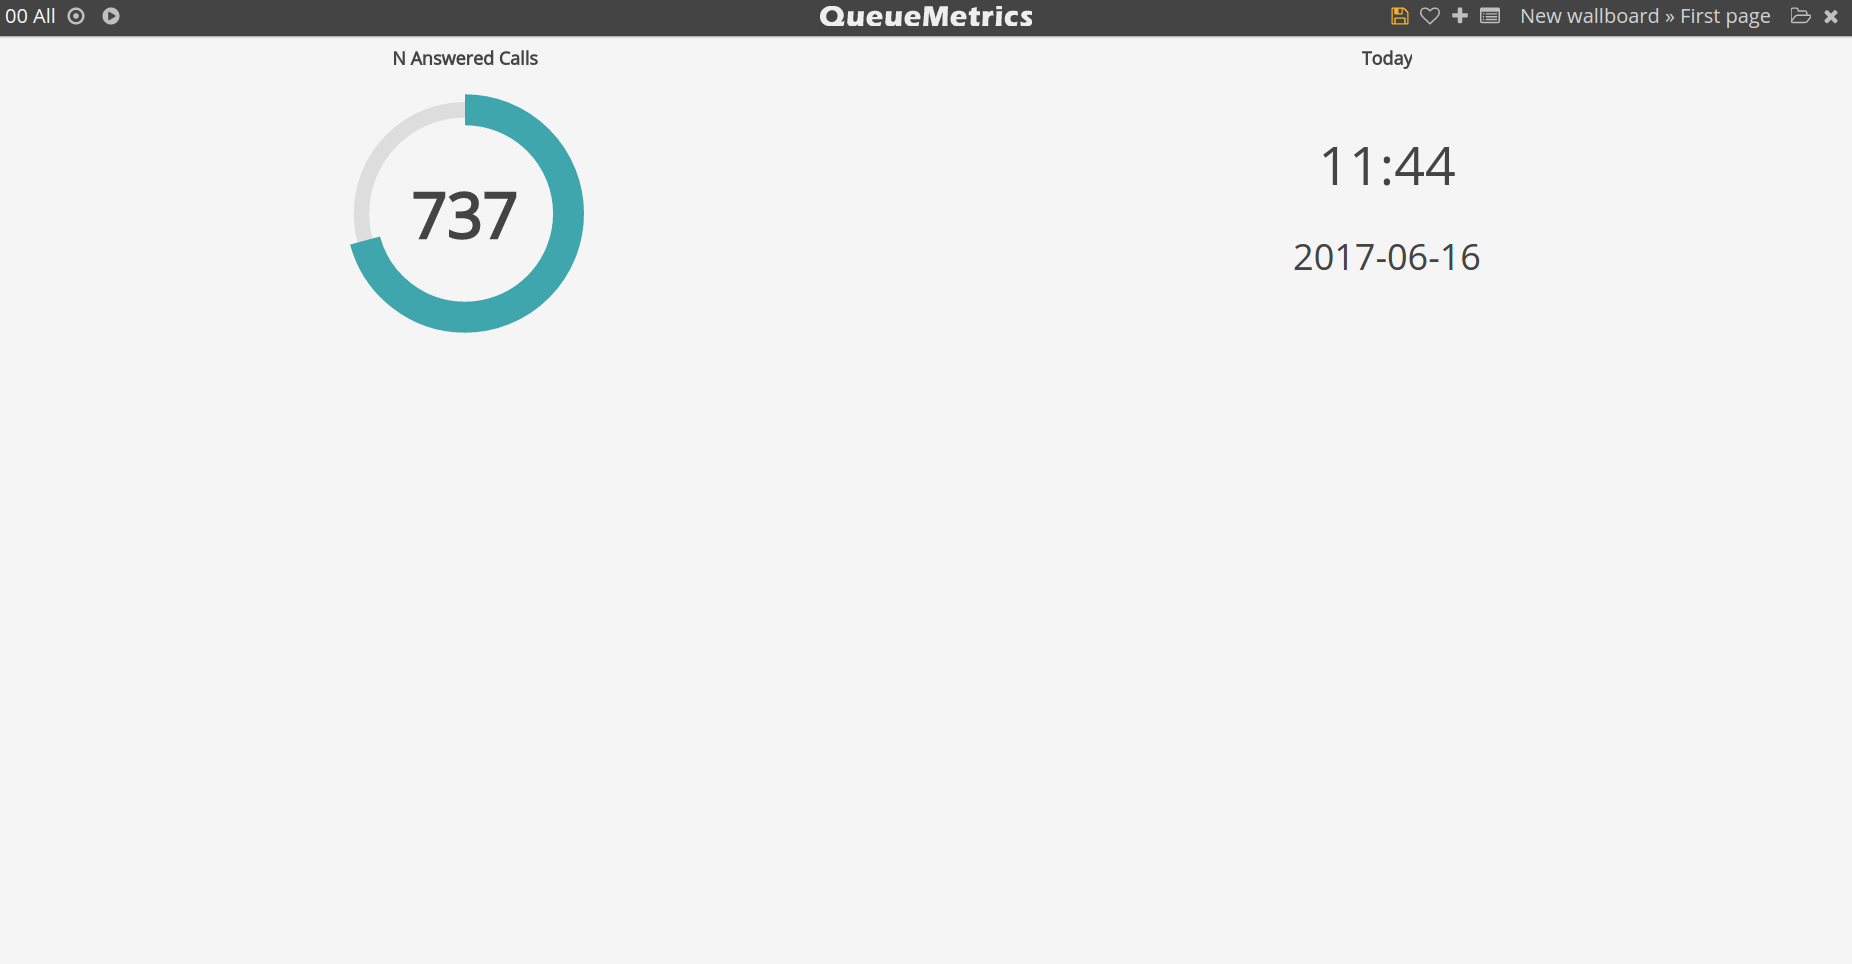
We can now resize or drag the widget with our mouse. Doing this will trigger the save button on the top right corner of the screen. Click on the save button to save your Wallboard.
Step9) Widget Configuration
If we hover with our mouse on to a widget we can see an icon on the top of right corner of the widget itself. Clicking on that will open the Widget’s configuration menu.
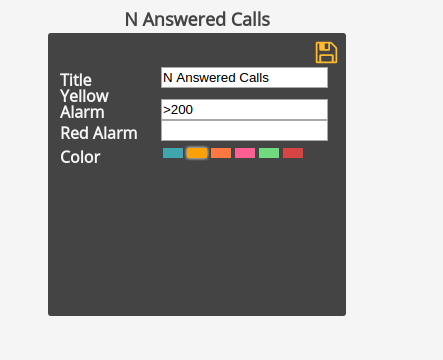
From here we can set the widget’s title, color and alarms. Alarms are warnings that a widget’s value has surpassed a certain threshold. Let’s set a yellow alarm for when the widget surpasses 200 answered calls.
Step 10) Alarms.
As we can see the widget is now yellow, this is because the yellow alarm was triggered by the widget’s value surpassing the threshold we set earlier.
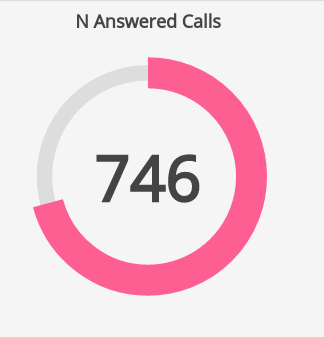
Step 11) Change color
From the Widget’s configuration menu we can also change the widget’s colour, let’s set this widget to pink. (Remember to delete any alarms, if an alarm is triggered it overwrites the widget’s colour).
Step 12) Add various widgets
Let’s now add some other Circular Panels to get comfortable with all the different options.
Step 13) Required Configurations
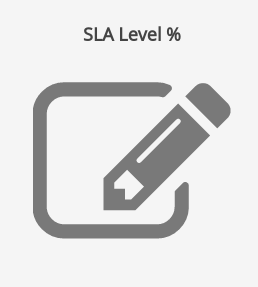
Some widget’s will show this big grey icon when they are added to the page. This means that, in order for them to work correctly, the need to be configured first. For example the circular panel “SLA Level %” needs a SLA level to be selected in order to show the correct value. To set the widget open the Widget’s Configuration menu.
Step 14) Setting the required Configuration
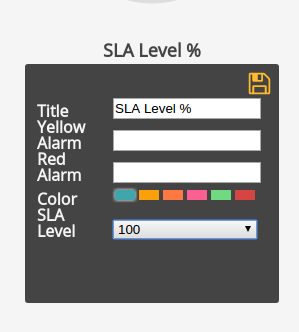
Once we set the necessary property we can save the widget and it will work.
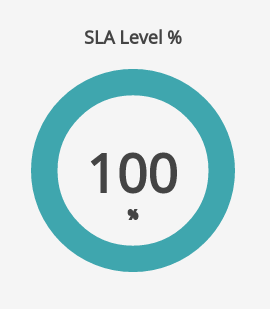
Step 15) Working SLA Level %
Now we can add some more widgets to our wallboard.
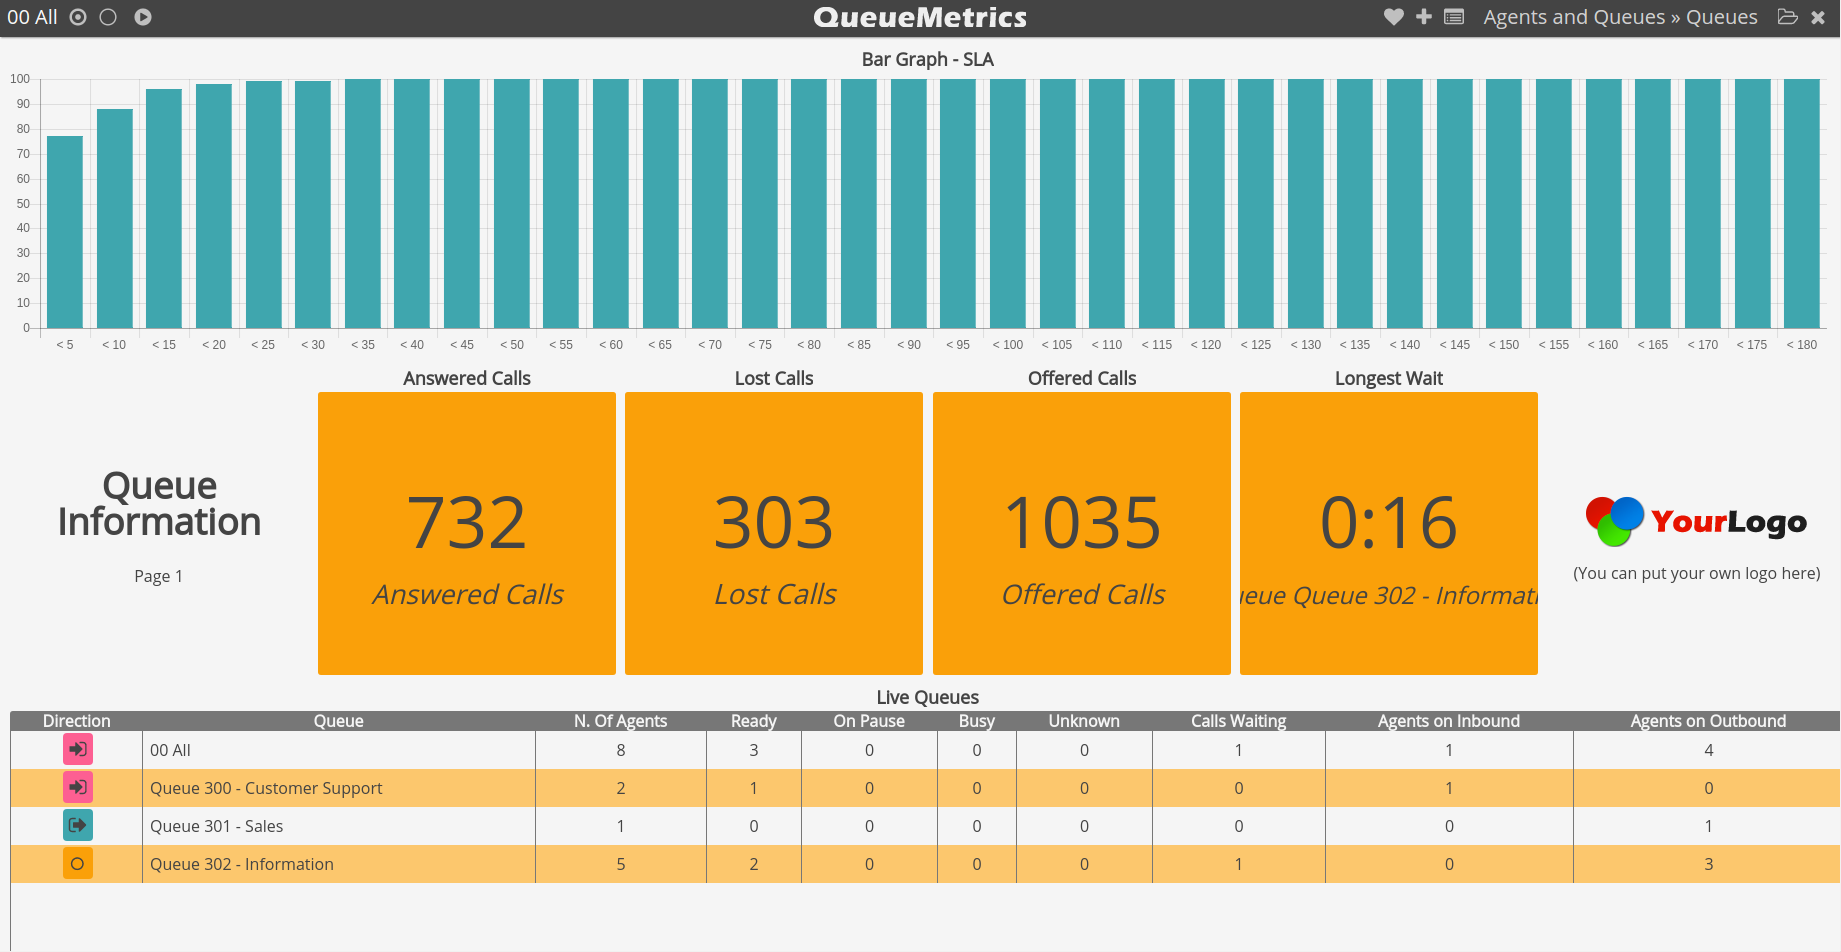
Step 16) Bar Graph - SLA
Let’s try adding the “Bar Graph - SLA” widget from the widget’s menu.
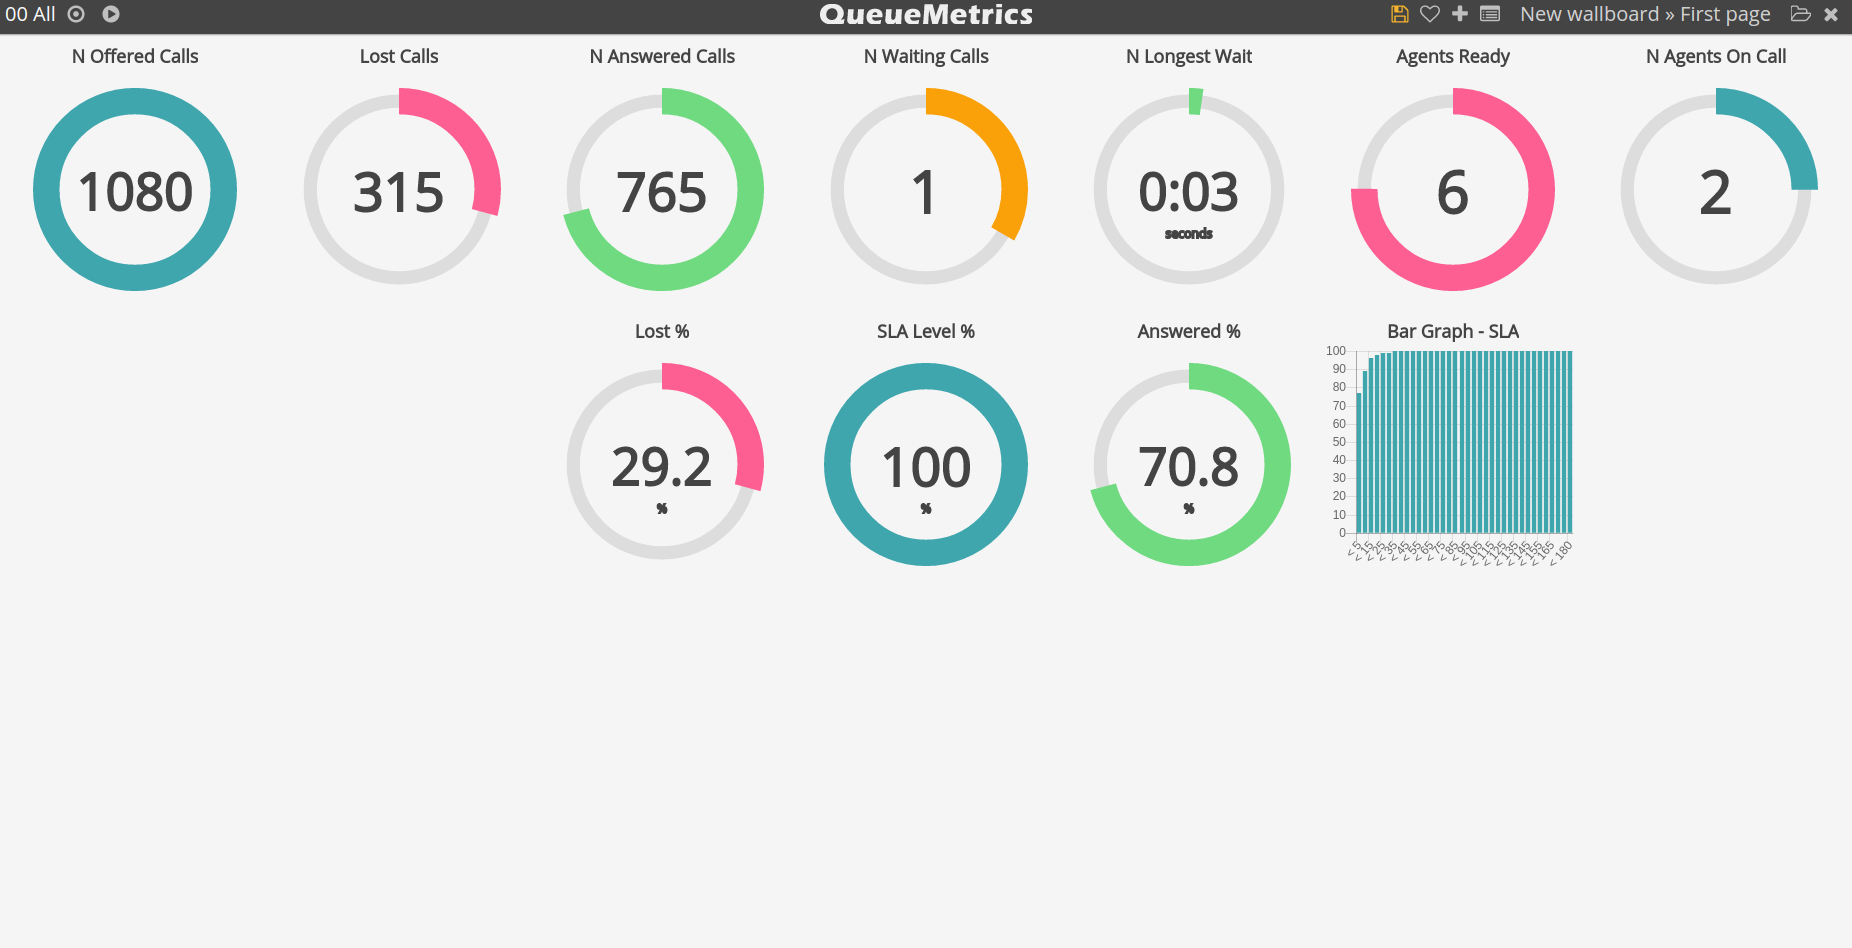
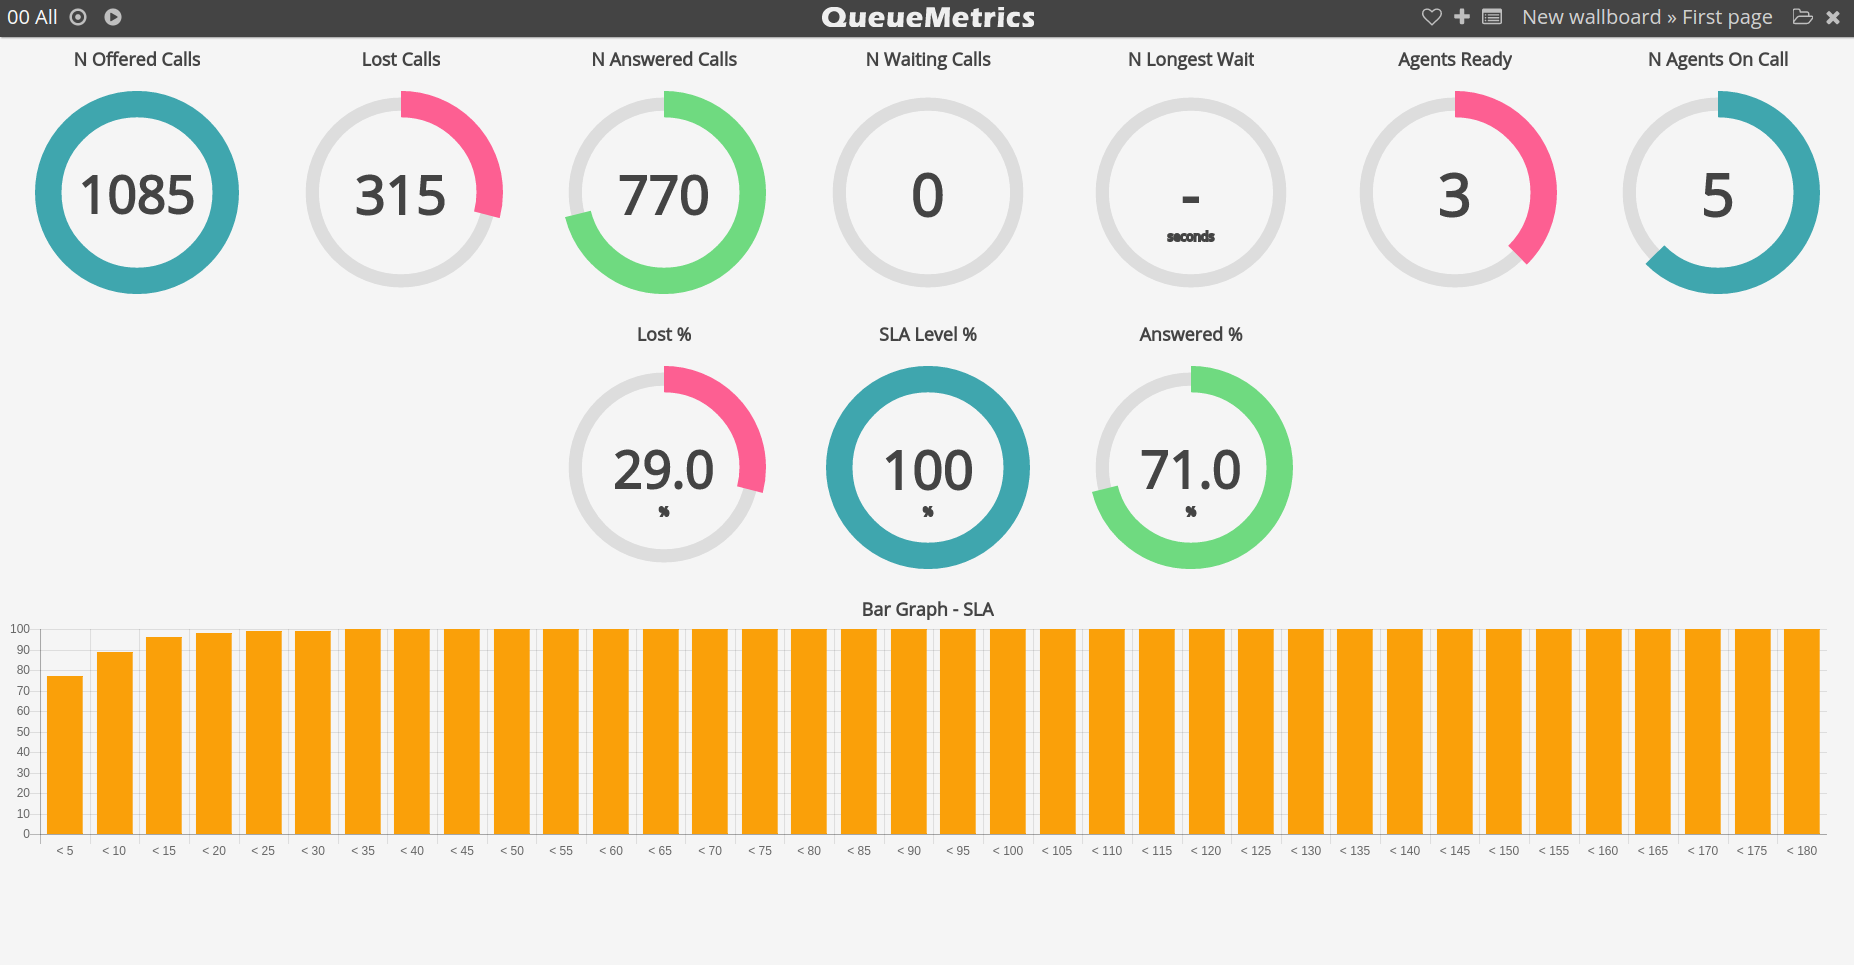
Step 17) Stretching the Graph
We can resize the graph to fully occupy the screen, in order to show all the different bars clearly. We will also change it’s color to orange.
Step 18) Live Agents Info
Now, let’s add a new type of widget, the “Live Agent Info” widget from the category “Composite Items”. This widget will require manual configuration before working correctly, because it needs an agent to be selected in order to show it’s status.
Step 19) List Views
Our next step is to add a new view to our Wallboard, in order to be able to cycle between two views in a presentation fashion. To do so, we have to click on the views icon on the top right of the screen, to the right of the Plus Icon.
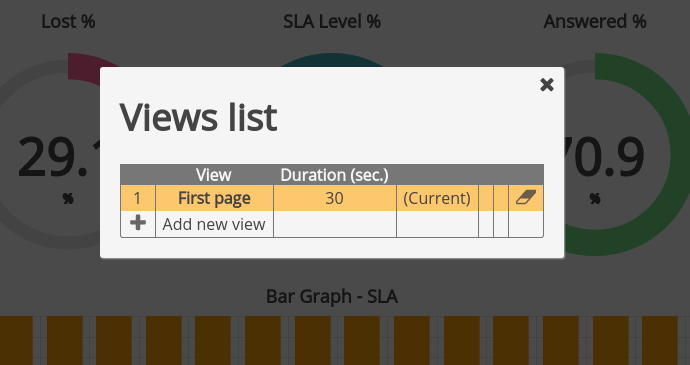
This will present us with a list of all the views, in this case though it will only show one view.
Step 20) Add a new View
If we click on the Plus icon at the bottom of the list we will be presented with a new, empty page of our Wallboard.
Step 21) Change View name
As we said earlier, we can click on the Wallboard’s name at the top right of the screen to change the settings of the current view. From here we can change the View’s name to “Second Page”.
Step 22) Live Calls table
We will now try out the “Table” widgets. Let’s go to the widget’s menu and select the “Live Calls” widget.
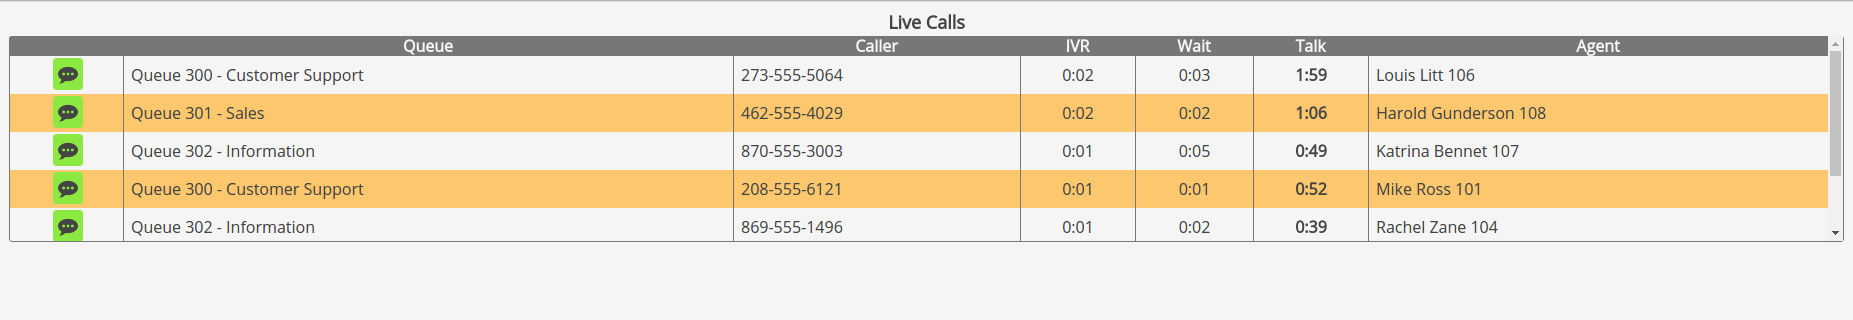
This table shows all the ongoing calls on the selected queues. We can see the status of the call as well as other information, such as the Queue, the caller, how much time the call spent in IVR or Waiting, the talk duration and the agent that answered the call.
Step 23) Live Queues Table
Let’s go back to the widget’s menu and add the “Live Queues” widget.
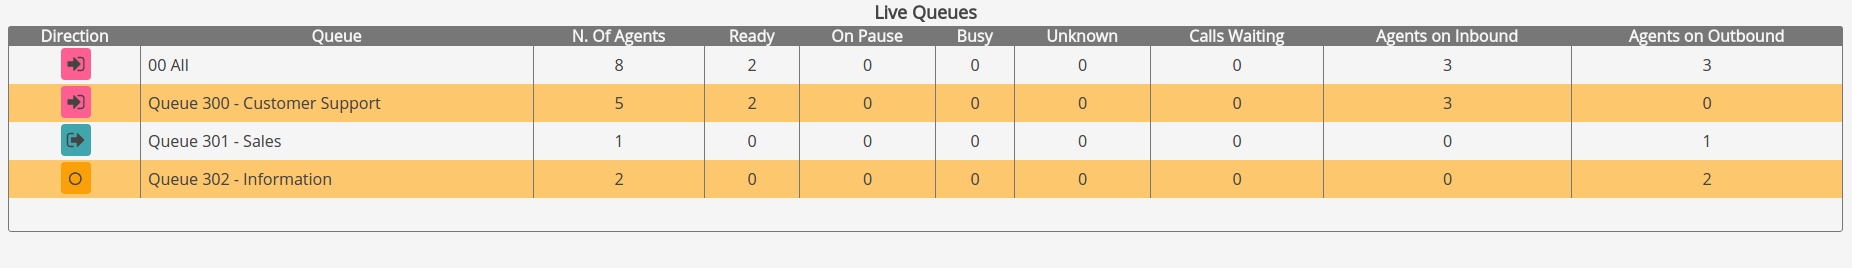
Similarly to the previous widget, this table shows all the information regarding the queues we selected. Only active queues will be shown. We can see information regarding the name of the queues, the number of agents on them, and how many agents are in different statuses.
Step 24) Live Agents Table
The last Table widget is the “Live Agents Table”.
As for the previous two tables, this widget shows all the information regarding the various agents logged in on our queues.
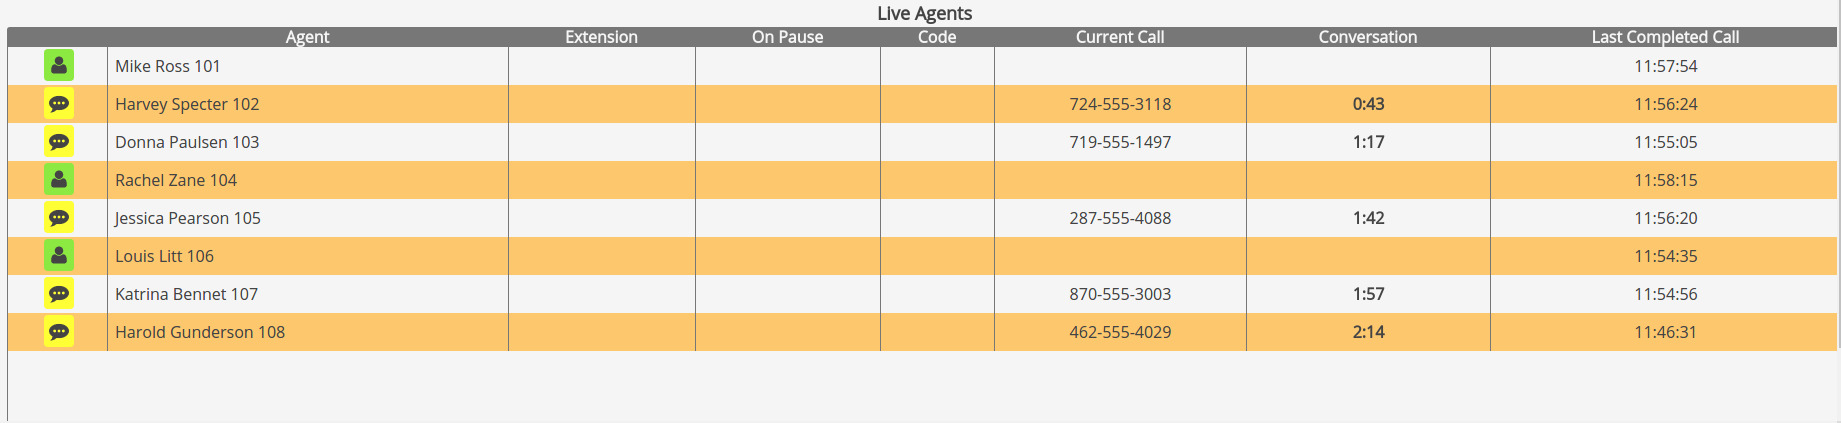
From here, we can check the agent status, the extension they are using, their pause codes, the current calls, conversation times and the time of their last completed call.
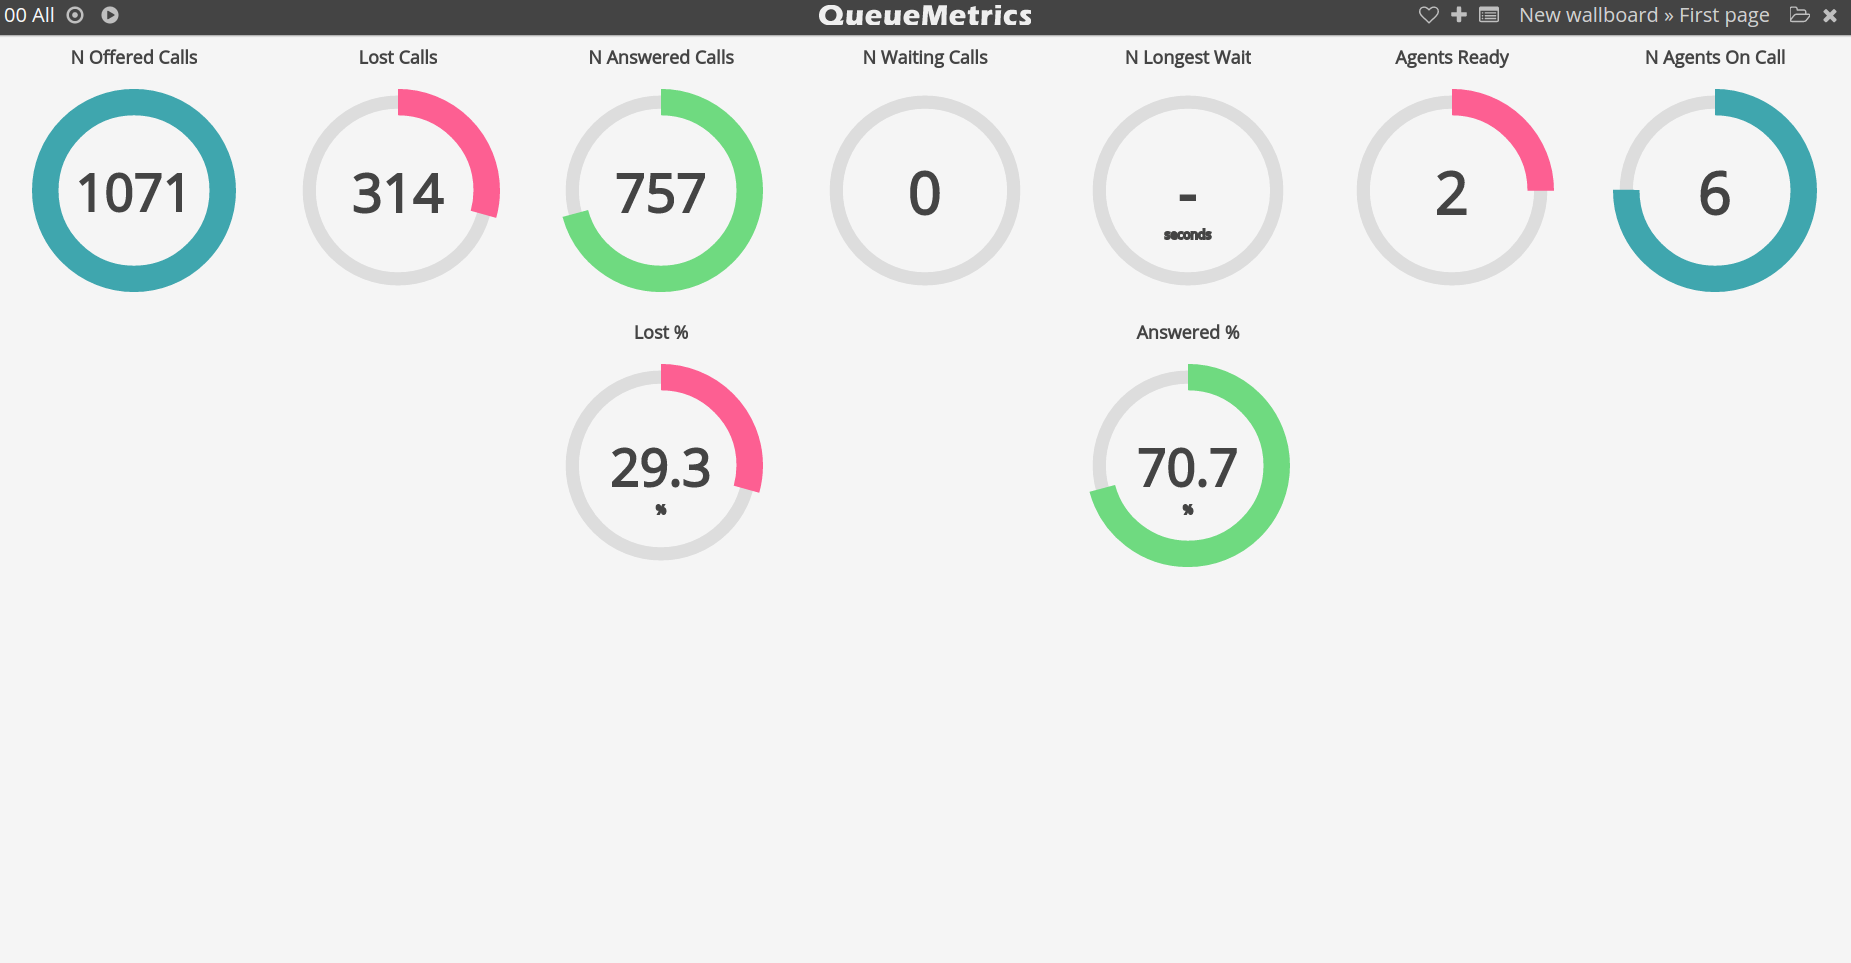
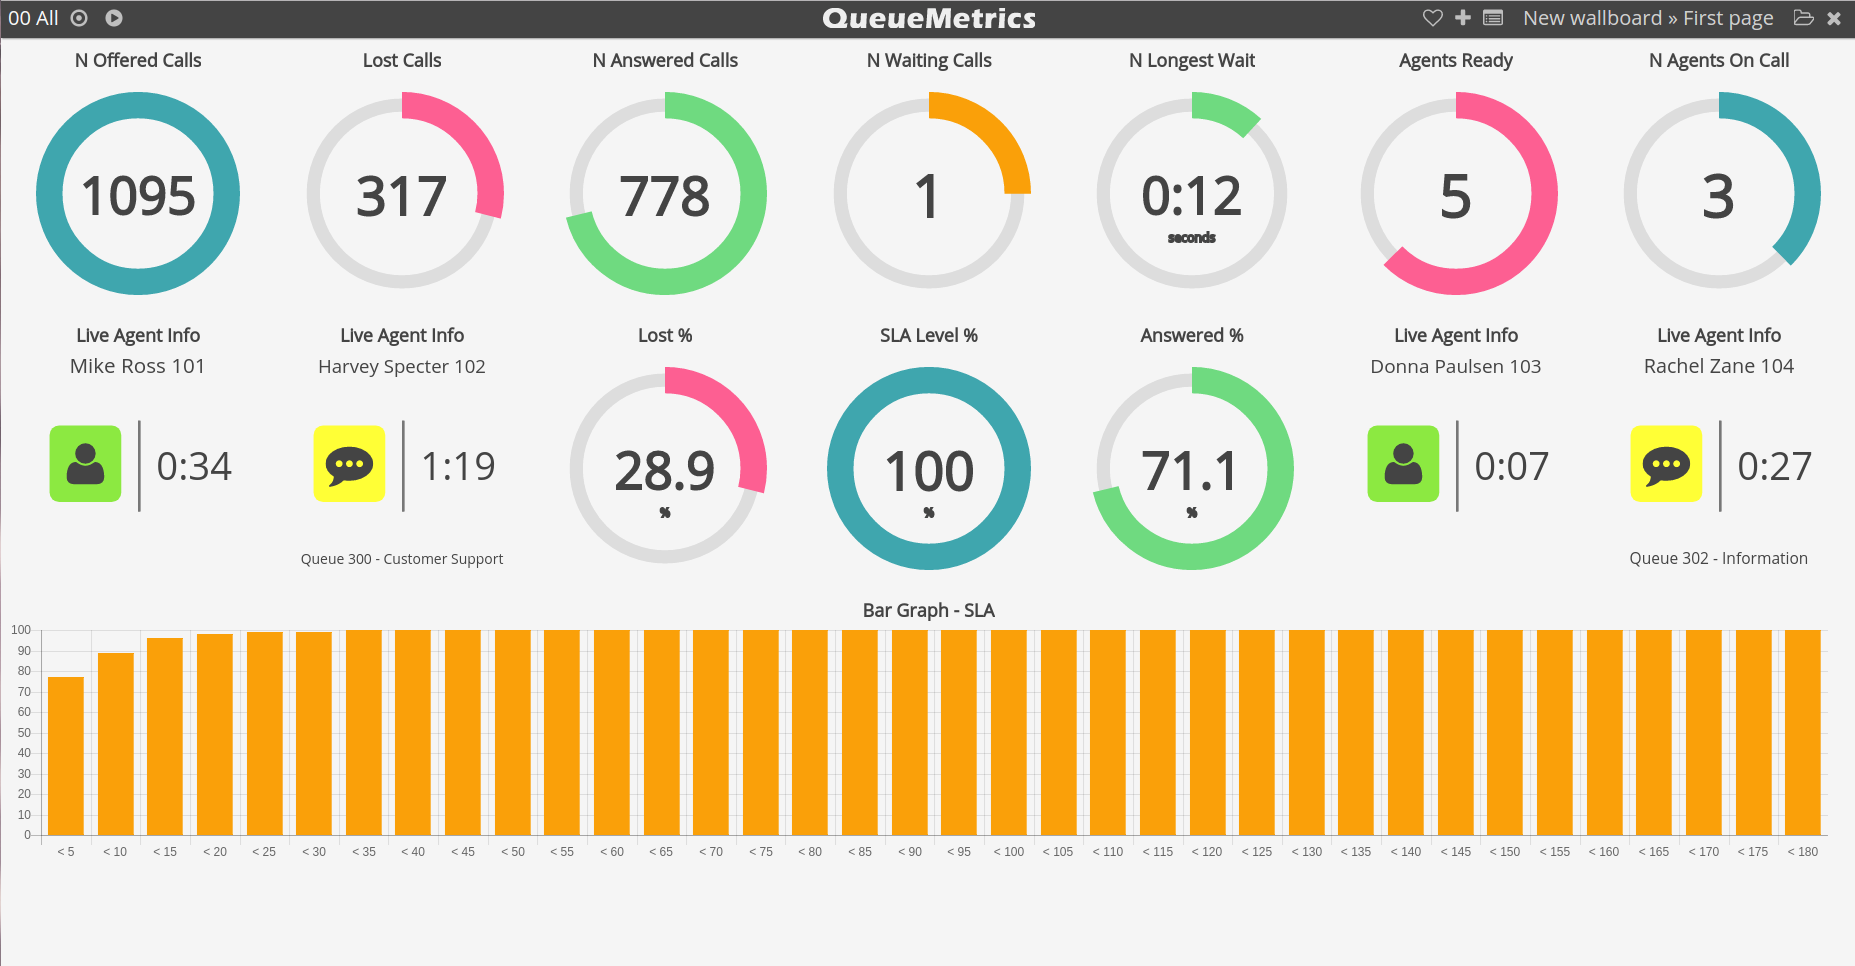
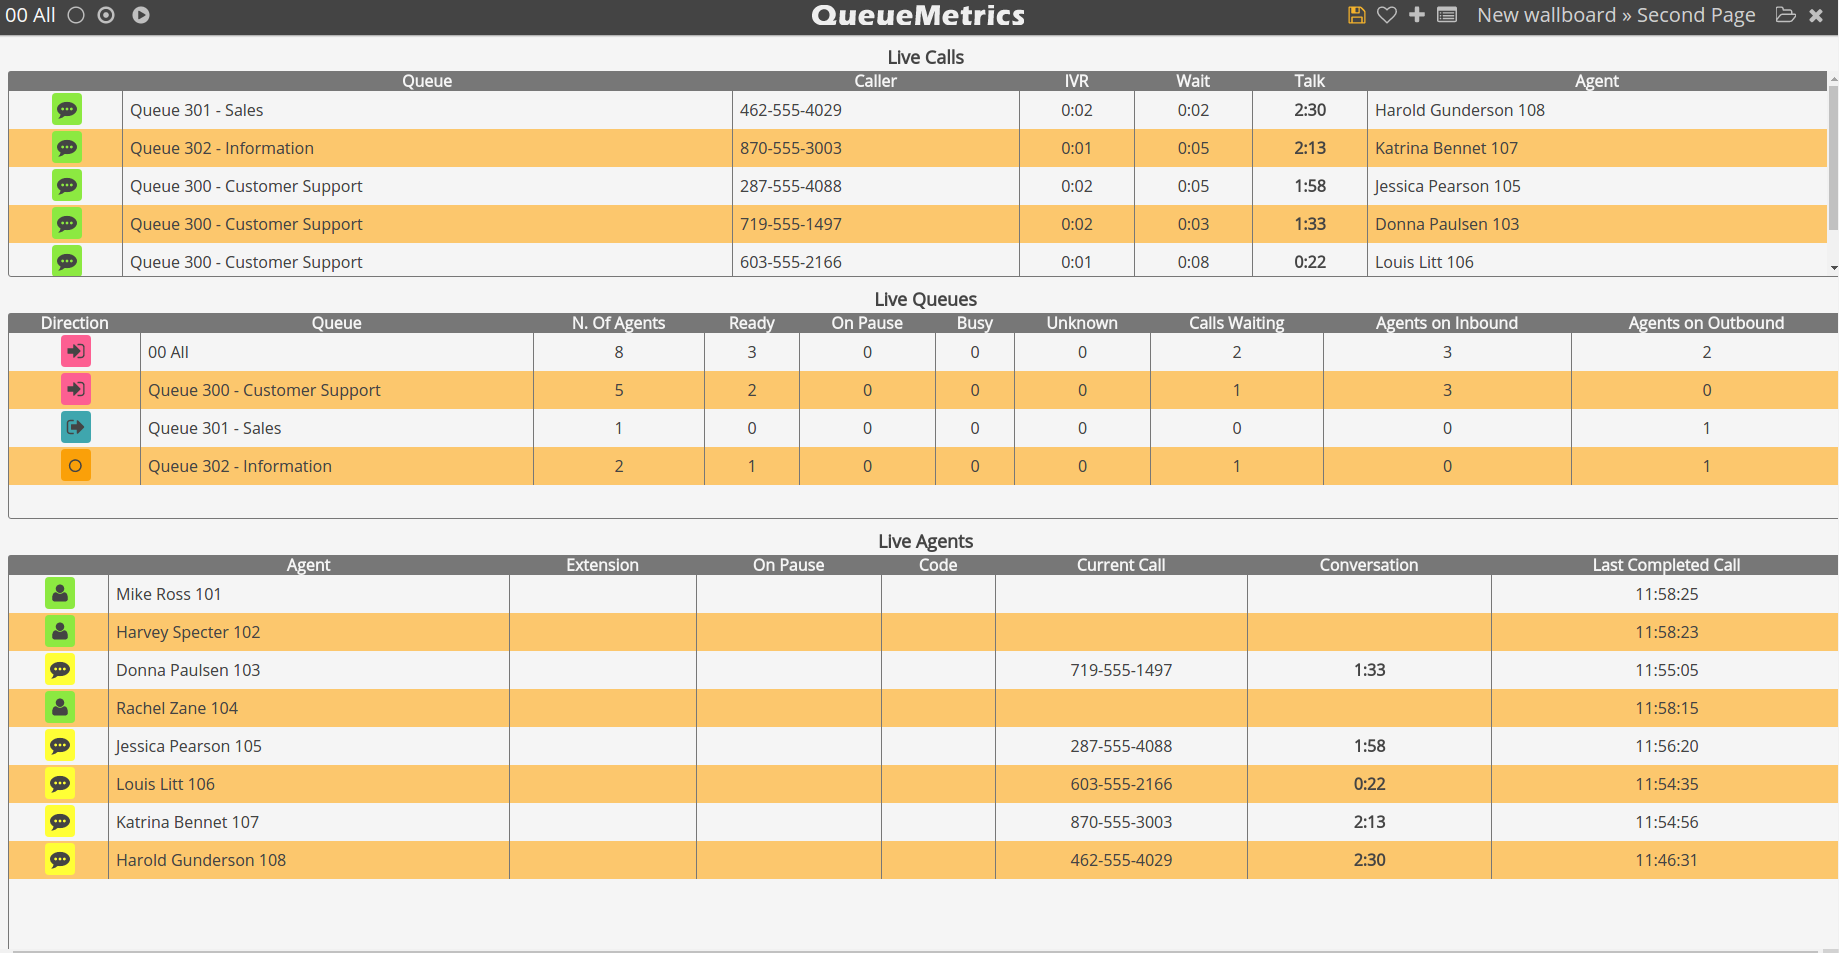
Step 25) Wallboard Complete
Now our wallboard is complete. Remember that it is composed of two different views and that you can cycle between them automatically by pressing the “Play” button at the top left of the screen. If you want to manually switch between views you can click on the “Circle” icons on the top right of the screen. Each circle represents a view and the full circle is the view you are currently viewing.
Try free QueueMetrics and the new Wallboard today. Visit www.queuemetrics.com for a trial.
keyboard_arrow_left Back