Integrating MiRTA PBX with QueueMetrics-Live

How can I connect my MiRTA PBX system with QueueMetrics-Live?
In this tutorial we will go through the necessary steps in order to integrate your QueueMetrics-Live instance with your MiRTA PBX installation. It just takes a few minutes.
QueueMetrics Live is natively multi-tenant, therefore it is a perfect fit for telephony providers running MiRTA, because each MiRTA tenant maps to a single QueueMetrics instance.
Each tenant sends data only to its specific QueueMetrics-Live instance, and only sends the queue information that you chose to share.
You can have as many instances as you need, and you can activate Live only for those customers that need it. This can be done as needed if you have just a few, or integrated with a fully automated provisioning and managing solution through our QueueMetrics Live Partner Program.
QueueMetrics
QueueMetrics is a highly scalable monitoring and reporting suite that addresses the needs of thousands of contact centers worldwide and offers a broad range of integrated benefits like agent productivity monitoring, target measurement, conversion rates tracking, realtime campaign statistics analysis and an easy to use interface. It’s available for MiRTA PBX as a cloud hosted service.
Obtain your QueueMetrics-Live credentials
Before starting this tutorial, you should already be in possession of your QueueMetrics-Live credentials.
If you don’t have your QueueMetrics-Live credentials yet, please update your PBX to the latest version and fill the request form at https://www.queuemetrics.com/qmlive-request-form.jsp
MiRTA PBX Setup
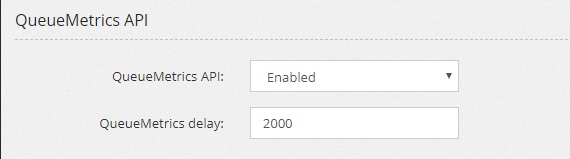
In order to setup your MiRTA PBX, you will first need to go to Admin => Settings => QueueMetrics API, and set:
- QueueMetrics API to “Enabled”
- QueueMetrics Delay to 2000
This will enable the QueueMetrics API.
Once this step is completed, you will need to identify which queue you want QueueMetrics to be able to report on.
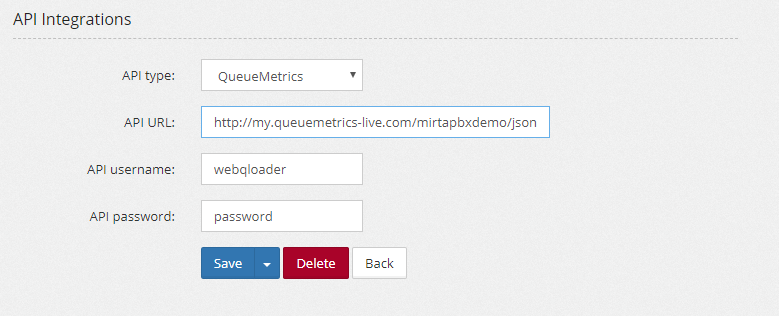
Once you know exactly which queues you want to monitor with QueueMetrics, you can go to each queue settings, and edit the following parameters under Configuration => Queues => The queue you want to edit => API Integrations.
- API Type: QueueMetrics
- API URL: Your QueueMetrics-Live URL, followed by “/jsonQLoaderApi.do”. For example, if your URL is:
http://my.queuemetrics-live.com/livedemo
then the full value would be:
http://my.queuemetrics-live.com/livedemo/jsonQLoaderApi.do
- API Username: webqloader
- API Password: Your QueueMetrics-Live password
Once this is done, click on “Save”, and the MiRTA PBX should start loading data to the QueueMetrics.
QueueMetrics Setup
Check that the data has been uploaded
On the QueueMetrics side, you will need to setup two different aspects of the integration. The first aspect would be that of creating the Queues and the Agents necessary to monitor your Call Center.
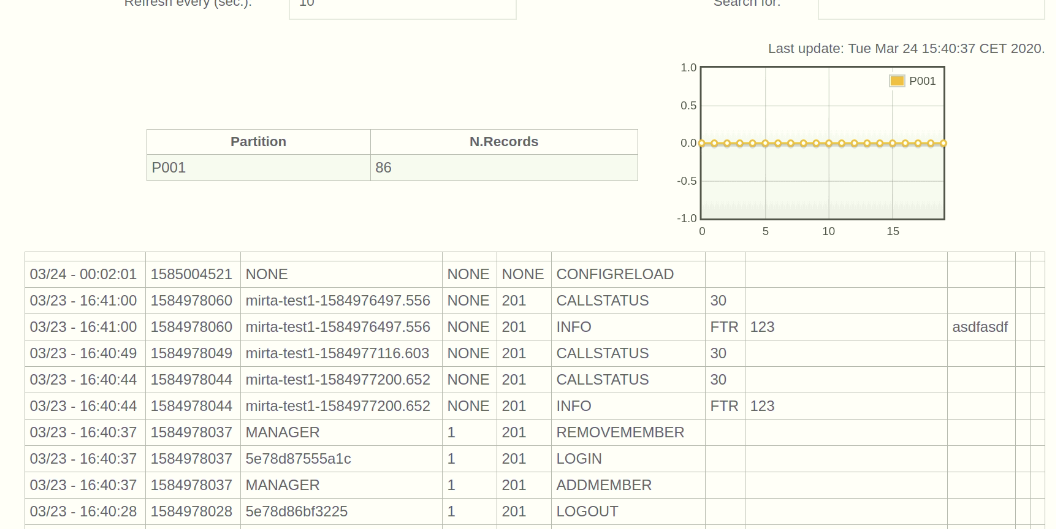
Firts, you will need to ensure that the data from the MiRTA PBX is being loaded correctly. To do that, you can navigate from the QueueMetrics-Live Home Page to:
System Diagnostic Tools => Live DB Inspector
Here you should start seeing some records of your queue activities.
Queue Setup
Now you can go back to the Home Page and navigate to Queues. Here, you should create a queue for each queue that you want to monitor.
When creating a queue, you should fill in the following information:
- Queue Alias The name you want QueueMetrics to display in the reports when showing data for that queue. This will be that queue alias in QueueMetrics.
- Queue(s) This needs to be the queue ID of the queue you want to monitor, as shown in MiRTA PBX. You can find the Queue ID in the URL of the queue editing page in MiRTA PBX. For example, while opening a queue, you will find that the URL is someting like:
https://YOURMIRTAPBXADDRESS/pbx/queue.php?quid=1
What you need is the value after “quid=”, so in this case the value is 1.
Once you have entered the correct information, you can save the queue.
Repeat this process for all the queues you need to monitor.
Agent Setup
Now, you need to setup the agents that you want to monitor. This is a very simple process, and it’s very similar to the queue creation process.
First, navigate from the Home Page to the Agents page.
Here you can create new agents. For each agent you will need to input the following Information.
- Asterisk agent code The agent code will be “agent/” followed by the extension number, for example 200 (agent/200).
- Agent description The name you want QueueMetrics to show in the reports when showing data for that agent. This will be that agent alias in QueueMetrics.
Leave the rest of the fields empty and save the agent. Now we need to create a corresponding user.
From the Home Page navigate to Users and create a new user.
Add the following information:
- Login This needs to be the same as the agent’s agent code (agent/200 for example).
- Password The password for the user.
- Confirm Password The password confirmation field.
- Real Name The name of the user.
- Class This must be set to AGENTS.
Now save the user, and repeat the process for each agent you would like to monitor.
System Parameters
The last thing you will need to do, is set the following system parameters, by navigating from QueueMetrics’ Home Page to Edit System Parameters.
Go to the bottom of the page and add at the end:
platform.mirtapbx.baseurl=${BASEURL}
platform.mirtapbx.key=${KEY}
platform.mirtapbx.tenant=${TENANT-CODE}
default.hotdesking=0
platform.pbx=MIRTAPBX
Where ${BASEURL}, ${KEY} and ${TENANT-CODE} should be substituted with the url of your MiRTA PBX, the API key for your tenant, and the tenant name.
for example:
platform.mirtapbx.baseurl=https://my-mirta-pbx.com
platform.mirtapbx.key=a234Dadf4dfsdg4
platform.mirtapbx.tenant=TEST
default.hotdesking=0
platform.pbx=MIRTAPBX
NOTE: Make sure the ${TENANT-CODE} (tenant name) does not have spaces or special characters (@-!?,ecc..) in the name.
Here an example of TENANT-CODE:
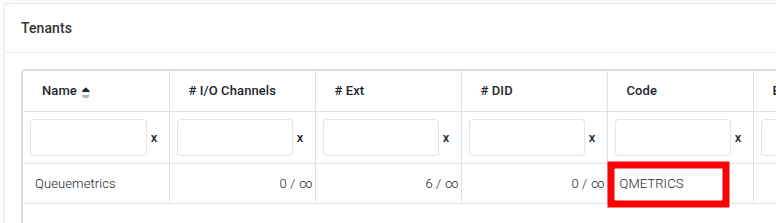
Save the changes and you should be able to operate your QueueMetrics seamlessly.
With this step the integration is complete, and you can start monitoring your agents and queues. For more information on how to operate QueueMetrics, please refer to our online manuals.
QueueMetrics References
QueueMetrics Live software is available as a cloud hosted service for FreePBX, Yeastar S PBX, Grandstream PBX, Issabel, FusionPBX, MiRTA PBX and most Asterisk distros. We offer a concierge service for potential customers, so we will do the integration with you and will walk you through the first steps on QueueMetrics with a free on-line meeting.
For more technical information please refer to the User Manual.
Visit www.queuemetrics.com for a free full featured trial.
Attend our Free Webinars for a live demonstration of QueueMetrics.
keyboard_arrow_left Back