The system is so slow today... but what is it doing?

How to monitor QueueMetrics over JMX?
Sometimes we encounter performance issues on systems we run: it’s not always easy to understand what is actually going on. An application feels slow. But why?
A lot of times, resolution is based on trial and error; if we are lucky, the problem is fixed. Of course this is not the best way to work. You hear people telling you to give more memory to the system, or a quicker disk, or more CPU, and sometimes it works.
But we can definitely do better.
One of the nicest things of the Java environment, the one that sits behind QueueMetrics and WombatDialer, is that it offers a very accurate and detailed view of what is actually going on. You do not need to use a special build of the software that is meant to gather statistics, and you do not have to pay a high performance price for understanding what the system is doing, so that it is perfectly acceptable to gather live statistics on a production environment.
Even better, JVMs are built for being monitored, so that there is a standardized ecosystem of tools to help you understand what is actually going on. This approach is called JMX.
The downside – as you can imagine, there is always a downside - is that setting JMX up is not so simple. Especially if you need to monitor a system from a different machine, e.g. a production server from your workstation, the set-up will have you pulling your hair off before you understand all the options you need to to set up a working connection.
To make your life easier, we made it possible to set up a fully working JMX connection just by uncommenting a single line, and creating an SSH tunnel that will let us access the data in a secure way.
You will need a recent Tomcat RPM (8.5.64 or newer).
So, once it is installed, you edit /etc/sysconfig/qm-tomcat6, and where it says:
      # Remove the comments below to activate JMX monitoring
      # JAVA_RMI_ADDRESS=localhost
      JAVA_JMX_PORT="30000"
You uncomment the line with JAVA_RMI_ADDRESS; save the file and restart. You just need to do this once, and this can be done safely even on production systems.
You can change the JMX port if you need to - does not matter which port you choose, as long as it is the same on your PC and on the server.
Now, you go to your workstation and start a new SSH session with the following incantation, to create a local tunnel for port 30000 and the following one too:
      	ssh root@my.queuemetrics.server \
      	    -L 30000:localhost:30000 \
      	    -L 30001:localhost:30001
You can now run VisualVM on your workstation - most likely it will already be installed if you have a Java SDK; if not, you can download it from: https://visualvm.github.io
Note that while the example above logs in over SSH as ‘root’, any user will do.
When you launch VisualVM, you should now click on the button ‘Add JMX connection’, and create a new connection to ‘localhost:30000’, with no password and no encryption (as we use SSH for security and encryption).
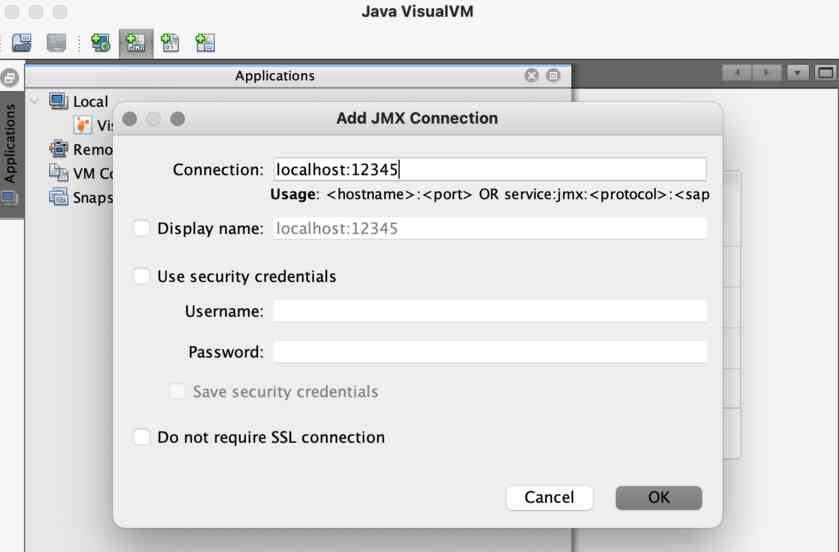
When done, click on the newly created connection to start monitoring.
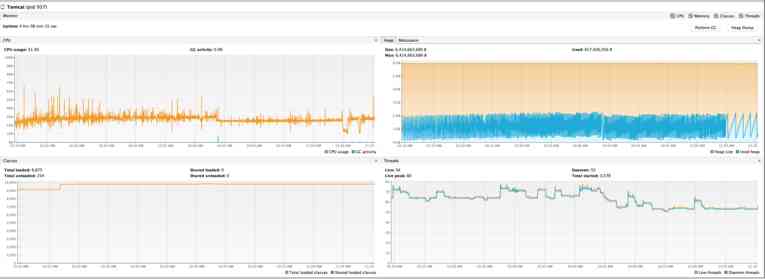
For example, in the graphs above, we can see that:
- CPU usage is around 30%, and is stable (graph on the left). Very little garbage collections, that are usually the main culprits for Java performance problems.
- We have no memory pressure. The system hovers around 2G of usage (graph on the right)
- The system was kind of idle in the last few minutes - it did not allocate much memory, but it is computing something.
- We can know what it is doing by getting a thread dump.
A number of interesting things can be done with VisualVM:
- ‘Know your JVM’: you can see the JVM settings from ‘Overview’ / ‘JVM arguments’.
- ‘Memory monitoring’: you can see the current CPU, memory and thread usage from the ‘Monitor’ page. Note that with most settings, it is normal that all memory be used up before a garbage collection is performed; so you would expect to see spikes and falls in the graph. You can also force a garbage collection if you want to see the “true” memory usage, but this may be unwise on heavily loaded production servers.
- ‘Thread monitoring’: you can get a textual thread dump like the one discussed above by selecting ‘Threads’ / ‘Thread dump’.
- You can use the ‘Sampler’ to acquire a breakdown of memory and CPU usage per class (you first need to install the plugin ‘VisualVM-Sampler’ from the Plugins menu, if not already available).
- You can keep a server open with multiple instances of VisualVM in order to monitor multiple QM servers.
Happy monitoring!
QueueMetrics References
QueueMetrics software is available on premise or as a cloud hosted service for FreePBX, Yeastar S PBX, Grandstream, Issabel, FusionPBX and many other Asterisk distros.
For more technical information please refer to the User Manual.
Visit www.queuemetrics.com for a free 30 days full featured trial.
Attend our Free Webinars for a live demonstration of QueueMetrics.
keyboard_arrow_left Back