QueueMetrics Tutorial: Debugging missed reloads on the Icon Agent page
QueueMetrics call-center suite for Asterisk PBX includes a ready to use agent interface called Icon.
Using Icon an Agent can completely manage the daily workflow using pauses, outcomes, features codes, a WebRTC softphone, log in queues and associate Q/A forms to calls.
This tutorial’s purpose is to detail how to debug missed reloads on the Agent page, in case it doesn’t refresh when something is supposed to happen.
Note: Make sure your QueueMetrics is at least version 20.11.17
QueueMetrics
QueueMetrics is a highly scalable monitoring software that lets you track agent productivity, payrolls, measure targets, conversion rates, ACD, IVR, Music on hold, generate outbound campaign statistics and monitor realtime processes with customizable wallboards.
You can measure all contact centre activities with more than 200 different metrics and manage realtime processes with extensions and calls control, live alarms, whisper mode, spy and barge mode.
Debugging missed reloads
If your agent page does not seem to refresh when something is supposed to happen, this might be due to three different causes:
- the action you expected to happen has not actually happened, or QueueMetrics was not notified it happened;
- the action happened at the wrong time (e.g. seemingly in the past or in the future);
- the action happened for the wrong agent.
In order to diagnose these kind of issues, you need to open a second browser window displaying the Database tester page (Settings -> Diagnostics):
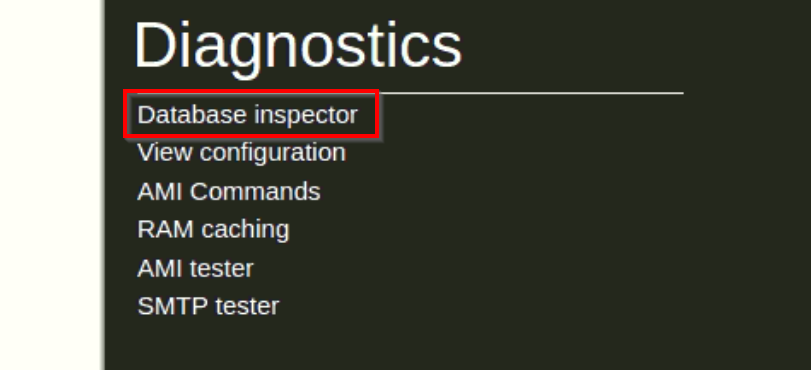
Note: If you are missing the Diagnostics section, add the “USR_DIAGNOSTICS” User Key, to the User you are currently using, then log out and back in.
On this page, you will see the latest records coming in from the PBX, and you will see a value called “Time Delta” that shows how old are the latest records that came in. You would expect Time Delta to be zero, if you have new records coming in, and the clocks of the PBX and of the server are aligned.
TIP: In order not to drown in a deluge of log entries that make it impossible to understand what is happening, make sure that you run these tests on a system that is not being actively used, e.g. off hours.
An example of the first kind of issue, action not happening, is when you try logging on to a queue, but the agent page keeps showing a “spinning” icon and then the queue goes back to not logged in. If you force a page reload, the queue is shown as not logged in. By looking at the database inspector, you can see if any log is generated (in which case, see case “wrong agent” below) or if no log is generated at all. In this later case, you have an issue with the way logins (and actions in general) are performed, maybe an incorrect setting of the AMI or a missing dial plan entry.
An example of the second case, wrong time, is when you see records being sent but time delta tells you they happened in the past or in the future. The agent page keeps asking for events that just happened, so if they happened in the past or they will happen in the future, the page does not know that there is new information and so it won’t reload.
You can test if you have a reload issue by forcing a reload of the page (by pressing F5), the page will display correct information. You may also notice this issue thanks to call duration, as observed from the wallboard or the real time page, are either too long or too short, but are correct in reports.
To fix this issue, make sure that the clock on the PBX and the clock on QueueMetrics server are aligned to a sub-second difference.
TIP: To keep clocks in sync, the easiest thing is to have them synchronized automatically using a public NTP server - this is nowadays supported by all servers and PBX manufacturers.
An example of the third case, wrong agent, happens when for some reason the agent page is looking at the wrong agent codes coming in on the logs. This may happen if your configuration is incorrect and for example the agent page is looking for a SIP agent but the actual logs contain PJSIP. While the result of the analysis is a bit more forgiving (so when you force a reload by F5 it may look correct), the agent page, for efficiency reasons, requires exact codes to be matched.
To understand which codes are required, you may manually add a parameter to the page URL: dbgPoll=1, so that your agent page URL looks like http://queuemetrics.server/queuemetrics/qm_agentpage2_load.do?dbgPoll=1. This will force a reload of the page; at this point open up the browser console (it works better in Chrome) and look for entries like:
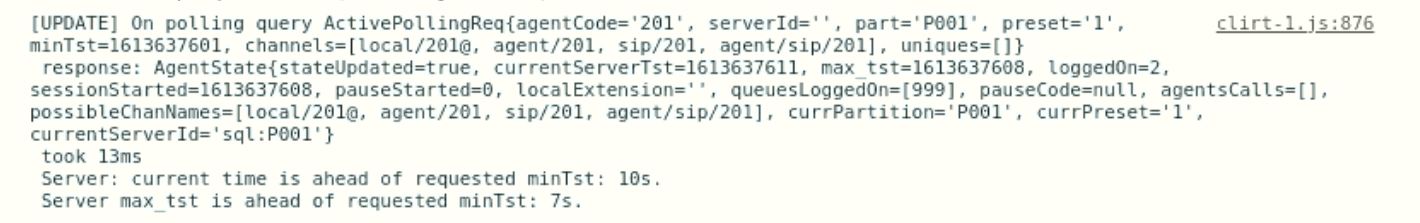
From these records you can see:
- the list of agent prefixes that were requested to the server (parameter
channels). They must match the agent field of any new logs coming in for the agent; - the minimum timestamp that should be checked for new data to trigger a reload;
- how long the service took from the point of view of the client;
- whether a full analysis was triggered or not (
stateUpdatedequals to true), also visually enhanced with a prefix[UPDATE]; - the current time on the server and the current known maximum timestamp for agent data.
QueueMetrics References
QueueMetrics software is available on premise or as a cloud hosted service for FreePBX, Yeastar S PBX, Grandstream, Issabel, FusionPBX and many other Asterisk distros.
For more technical information please refer to the User Manual.
Visit www.queuemetrics.com for a free 30 days full featured trial.
Attend our Free Webinars for a live demonstration of QueueMetrics.
keyboard_arrow_left Back