QueueMetrics detailed logs for better diagnosis
Why increase the logging level in QueueMetrics?
QueueMetrics is a powerful analytics platform for call centers, offering real-time and historical insights into your queue and tenant activity.
In certain circumstances—such as debugging complex issues or testing new configurations—you may need more detailed data from the application logs.
This guide walks you through raising the QueueMetrics logging level, capturing the necessary log output, and then reverting to normal operation.
Logging Level Instructions
- Ensure QueueMetrics is Inactive
Before making any changes, confirm that no one is currently using QueueMetrics or running reports. (as well as no scheduled jobs)
This will make things easier, avoiding unnecessary logs to go through.
- Adjust the Logging Properties
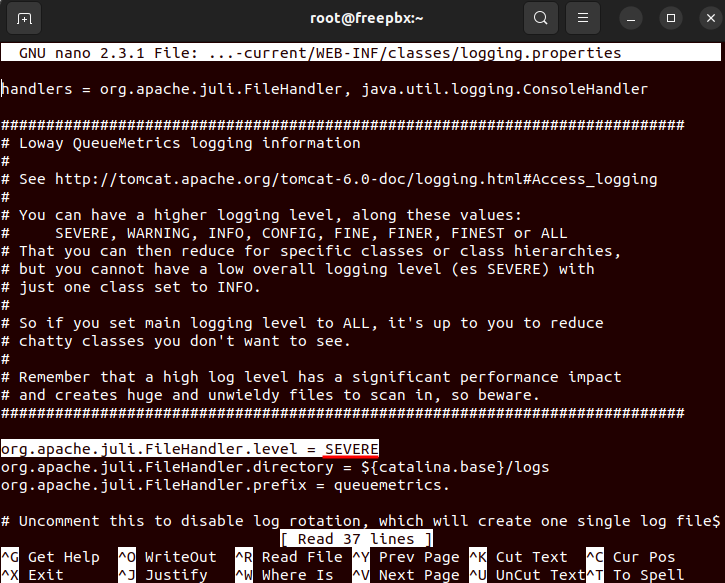
Open/usr/local/queuemetrics/qm-current/WEB-INF/classes/logging.propertiesin a text editor (for example,nano):nano /usr/local/queuemetrics/qm-current/WEB-INF/classes/logging.propertiesLocate the line:
org.apache.juli.FileHandler.level = SEVEREand change it to:
org.apache.juli.FileHandler.level = INFOThis will increase the amount of details logged by QueueMetrics.
- Restart the QueueMetrics Service
After saving the file, restart QueueMetrics:service queuemetrics restartOr, if your system uses systemd:
systemctl restart queuemetrics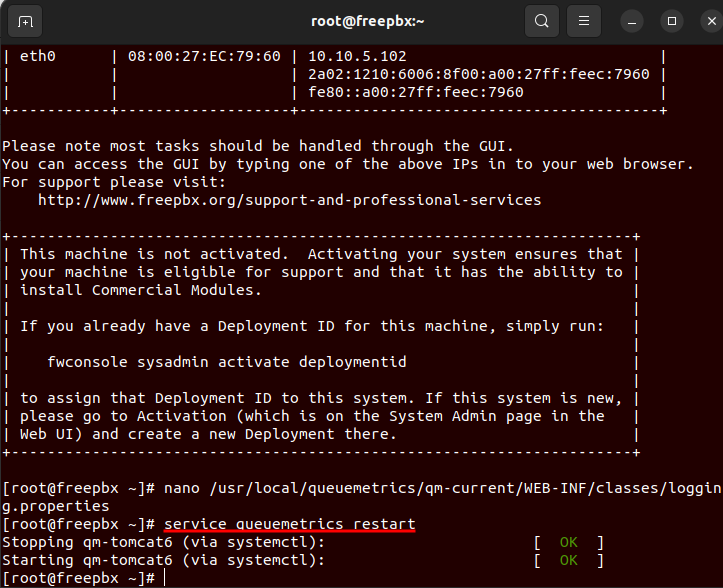
- View the Logs
You can view the logs while they are being written using tail:tail -f /usr/local/queuemetrics/tomcat/logs/queuemetrics.2025-02-XX.logReplace
2025-02-XXwith the exact date in your log filename.Keep this terminal open so you can see the live logs as QueueMetrics processes events.
- Run the Report
In the QueueMetrics web interface, navigate to the relevant wallboard or report you want to troubleshoot; then open the wallboard or run the report to reproduce the issue.
Any errors and extra details should now appear in the logs.
- Capture and Share Logs
Gather the logs while you replicate the issue. Note the exact time you replicated the issue. Then either:- Copy the text from your terminal.
- Or locate and grab the entire
/usr/local/queuemetrics/tomcat/logs/queuemetrics.2025-02-XX.logfile.
- Take a Screenshot
In the QueueMetrics browser interface, capture a screenshot of the report results. Ensure the time and date are visible along with any relevant call details.
- Revert the Logging Properties
Once diagnostics are done, editlogging.propertiesagain and revert:org.apache.juli.FileHandler.level = INFOback to:
org.apache.juli.FileHandler.level = SEVEREThis prevents logs from growing too large and impacting performance.
- Restart QueueMetrics Again
Run:service queuemetrics restartor:
systemctl restart queuemetricsOnce it’s back online, the system is again logging at the default SEVERE level.
About QueueMetrics
QueueMetrics is a highly scalable monitoring software that lets you track agent productivity, payrolls, measure targets, conversion rates, queues/ACDs, IVRs, music-on-hold, generate outbound campaign statistics and monitor realtime processes with customizable wallboards.
You can measure all activities in your contact center with more than 200 different metrics and manage realtime processes with live alarms and full control on calls and extensions, including whisper, spy and barge modes.
QueueMetrics is available on premise or as a cloud hosted service, and it is compatible with FreePBX, Grandstream, Issabel, MiRTA, Enswitch, Yeastar S PBX, VitalPBX, FusionPBX and many other Asterisk- and Freeswitch-based systems. It also supports Microsoft Teams telephony.
For more technical information please refer to the User Manual.
Visit www.queuemetrics.com for a free 15-day full-featured trial.
keyboard_arrow_left Back