Troubleshooting: Complete debugging of AMI commands on your PBX
If you are trying to send commands to the PBX through QueueMetrics (or WombatDialer) without success, here are a few things to be mindful of during the troubleshooting process.
QueueMetrics
QueueMetrics is a highly scalable monitoring and reporting suite that addresses the needs of thousands of contact centers worldwide and offers a broad range of integrated benefits like agent productivity monitoring, target measurement, conversion rates tracking, realtime campaign statistics analysis and an easy to use interface.
Debugging commands on the PBX
When you are trying to understand what happens when your QueueMetrics asks Asterisk to perform an action, and that action does not produce the required results, the first thing to do is to make sure that your AMI connection is valid - as explained in this troubleshooting tutorial.
If commands in general seem to work, but something is still not working, or is broken every once in a while, then you need to reach for a bigger gun: tracing the whole command to see where it breaks.
The way commands work in QueueMetrics is as follows:
- QueueMetrics sends a request to your PBX through its management interface (AMI)
- Your PBX processes that request and does something (e.g. logs an agent on, sets a disposition code on a call… you name it. Maybe it just fails.)
- As a side effect of what the PBX did, a trace is written on the file
queue_log - QueueMetrics receives a copy of
queue_logand updates its data - at this point you see the new status appear in the interface.
The whole process usually takes just a few milliseconds, so you just see things happening in QM.
What are platforms?
In detail, the way this actually works depends on your platform. A platform, roughly speaking, is the model of how the action is to be performed:
- Platform CLASSIC: QM originates a “fake” call on the PBX, where this calls a piece of dial-plan that comes with QM and must be included. This is the most flexible way, as you are free to edit that dial-plan to suit your scenario. The downsides are that you need to include dial-plan in your PBX and that to perform multiple actions in a sequence (e.g. logging an agent on to 10 different queues) it will originate 10 separate calls one after the other, and this might be slow, especially on busy PBXs.
- Platform DIRECTAMI: QM connects to the PBX over AMI and tells it what it needs to do. No need to include foreign dial-plan and is quicker than Classic as it can do multiple actions over the same connection. Its configuration options let you configure it for all common use cases. This is the current default.
- Platforms CLASSIC_LIVE and DIRECTAMI_LIVE: these are used in cases where there is no direct connection betwen QM and the PBX - e.g. on QueueMetrics Live systems. In this case, when you need to perform an action, it is stored on QM. The data loader Uniloader polls periodically for new actions, and when there are, it performs them on behalf of the QM system. The results are then sent back. You can see the latest actions performed and any actions still pending by clicking on “System diagnostic tools” -> “AMI queue”.
So the first thing you need to know is the current platform for your QM system. You can easily see it by clicking on “System diagnostic tools” -> “AMI queue” - there should be a line below the title saying: “Current PBX platform”.
Prerequisites
In order to go forward with this tutorial, you first need to make sure of a number of things:
- Just to be on the safe side: confirm that you see new data being uploaded to your QM database. Click on “System diagnostic tools” -> “Live DB ispector” and send a call to a queue. You should some data coming in after a few seconds. If not, there is a data load issue, and that needs to be fixed before anything else. See this tutorial for more information.
- Make sure you know which platform your QM system is using - see above.
- Make sure you have
rootaccess to the PBX. - Make sure there is no other traffic on the PBX but your tests. Most logs produce tens to thousands of lines per minute, so if you do your tests on a busy systems, the main challenge is spotting your records in the noise. Been there, done that. You don’t want to.
The battle plan
To diagnose issues like a pro, you need four things:
- The initial state of the queue subsystems: which queues are available and which agents are on them.
- A recording of what happened on AMI: as all activity starts with an AMI request, we need to know whether ther was a request at all, and what it was about. To do this, we capture all traffic to and from AMI.
- A recording of what happened within Asterisk when the request came through: the file
/var/log/asterisk/fullshows all logs produced, and how the dialplan was executed. You could get a similar view from the Asterisk console, but as it’s extremely chatty, it’s way too easy to get lost. Remember - no other traffic on the PBX but your tests. - A recording of what happened on queues, courtesy of the
/var/log/asterisk/queue_logfile.
So this is ideally how a debug session looks like:
To make sure you don’t have extraneous data, we will make a private copy of lines added to full and queue_log so that all you will see are the results of your tests.
Gathering data: tcpdump
The hardest part is setting up a capture of the AMI data. For this we will use a tool that is likely already present on your distro. It must be run on the same system as the PBX.
yum install -y tcpdump
First we will have to find which interface to listen to; to do this you can run:
# tcpdump -D
1.eth0
2.nflog (Linux netfilter log (NFLOG) interface)
3.nfqueue (Linux netfilter queue (NFQUEUE) interface)
4.usbmon1 (USB bus number 1)
5.usbmon2 (USB bus number 2)
6.any (Pseudo-device that captures on all interfaces)
7.lo [Loopback]
The set of interfaces on your system will be different; basically:
- you use
loif your AMI commands are sent to 127.0.0.1 (QM on the same box or Uniloader), or - you use
eth0or similar for external connections, or any, if present, is a safe choice.
If you cannot find AMI data on a port, you can try again with a different one.
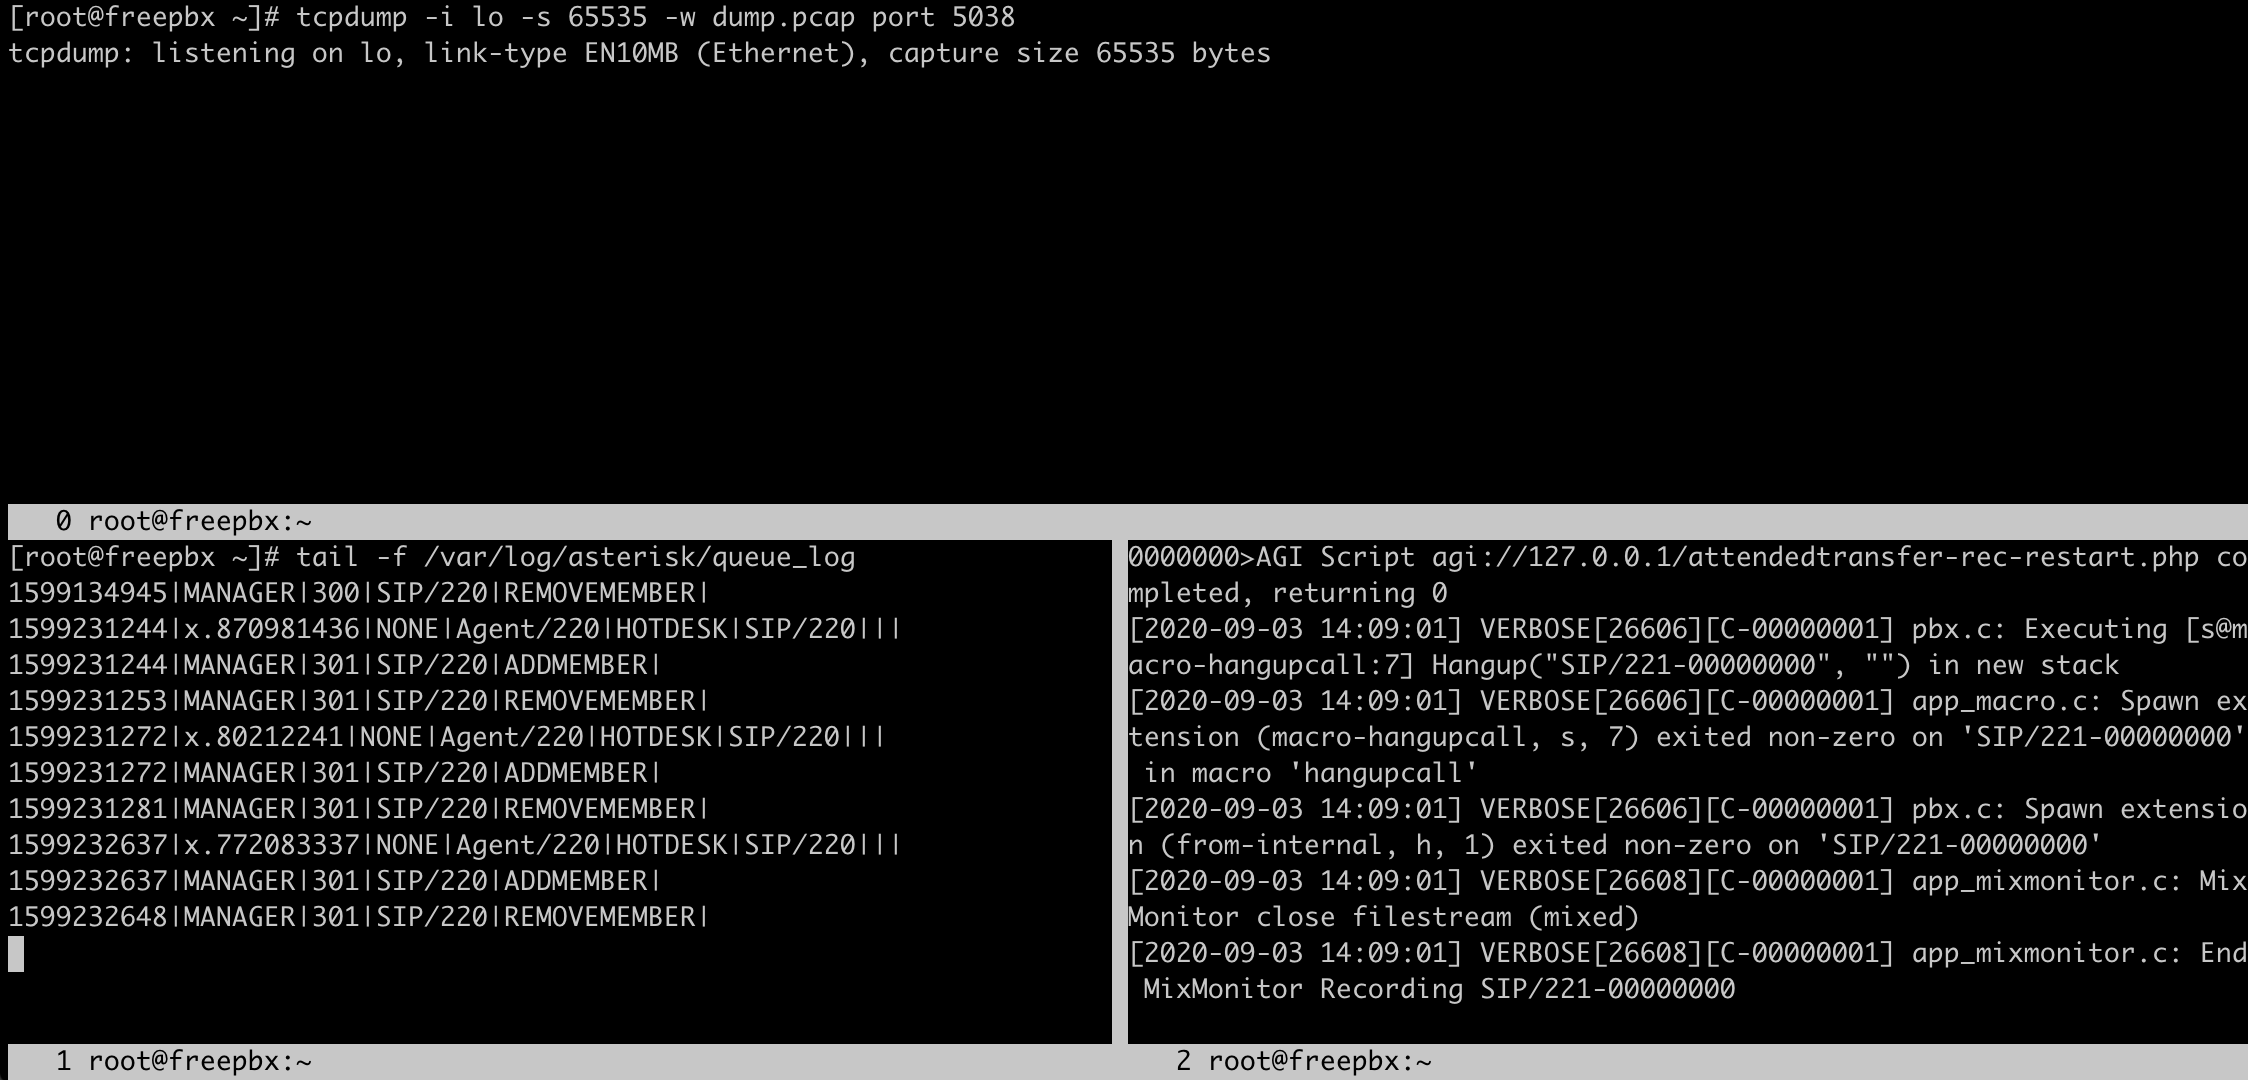
So, to capture all traffic on any that goes to port 5038 (AMI):
# tcpdump -i any -s 65535 -w /root/test01.pcap port 5038
tcpdump: listening on lo, link-type EN10MB (Ethernet), capture size 65535 bytes
^C
200 packets captured
400 packets received by filter
0 packets dropped by kernel
You stop the capture by pressing Ctrl-C; tcpdump will print out how many packets were captured. If it is zero, most likely you got the wrong interface or your AMI commands are being sent somewhere else.
We suggest using a different capture file for each test you make, so it’s easy to analyze. In this tutorial, files from each test gets a unique prefix, so it’s easy to spot what is what.
Gathering data: files
First we gather the status of the queue system:
asterisk -rx "queue show" > /root/test01_queues.txt
Then you open two different shells, and run:
tail -n0 -f /var/log/asterisk/queue_log > /root/test01_qlog.txt
tail -n0 -f /var/log/asterisk/full > /root/test01_full.txt
At this point you should have three shells open: one for tcpdump, one for queue_log and one for full.
Now you can run your test.
When the test is over, just press Ctrl-C in all shells so that the gathering stops.
At this point we have four files in our /root, neatly labelled, for each of the four components.
Analyzing results
A capture file might contain multiple sessions; sometimes there are daemons polling Asterisk, or other activity happening. So the first thing we need to understand is whether there are any QM sessions, and what are they.
To do this we install a package calld Wireshark that has a neat command-line interface:
yum install -y wireshark
And then run:
# tshark -r /root/test01.pcap  -T fields -e tcp.stream \
'frame matches "ActionID. AID"' | uniq
4
5
6
What we are doing here is to go look for the IDs of AMI connections where each action is neatly labelled in the way QM does it. So the output above is saying that there are three QM sessions, numbered 4, 5 and 6 (and also that there must be extraneous sessions as well - you may want to look at those as well).
Now to see one of those sessions (session 4 in the example):
tshark -r /root/test01.pcap -z "follow,tcp,ascii,4"
...
Follow: tcp,ascii
Filter: tcp.stream eq 4
Node 0: 127.0.0.1:5038
Node 1: 127.0.0.1:33980
29
Asterisk Call Manager/5.0.1

	96
Action: Login
ActionID: AID136686563
Username: zebra
Secret: weluvzebras
Events: off

79
Response: Success
ActionID: AID136686563
Message: Authentication accepted

	79
Action: QueueRemove
ActionID: AID485315848
Queue: 301
Interface: SIP/221

91
Response: Error
ActionID: AID485315848
Message: Unable to remove interface: Not there
....
We can easily see that each request QM makes is labelled with an AID, and so is each response. In our example, we can se that there is a queue remove action that goes wrong - Asterisk tells us that the it cannot remove interface SIP/221 from queue 301, because it’s not there.
This makes sense, as the initial status for the queues, as from /root/test01_queues.txt, was:
301 has 0 calls (max unlimited) in 'ringall' strategy (0s holdtime, 0s talktime),
W:0, C:0, A:0, SL:0.0%, SL2:0.0% within 60s
   Members:
      SIP/220 (ringinuse enabled) (dynamic) (Not in use) has taken no calls yet
   No Callers
So we know what happened and why - and we can infer that probably the extension code we are using is not correct.
Wrapping up
When you have all the data you need, problems stick out like a sore thumb. Most issues are caused by minor things, like trying to remove Agent/202 when the queue has member SIP/202, or trying to listen to a call that does not exist.
- If you find no AMI trace, or the login fails, most likely you have an issue with the IP address, username/password or general permissions.
- If your platform is CLASSIC or CLASSIC_LIVE, most of the activity is on the
fulllog. You use the AMI session to see the parameters that were set, and then read thefulllog to trace the execution, and you compare it to what you have on the queue_log. - If your platform is DIRECTAMI or DIRECTAMI_LIVE, most of the activity is on the AMI connection itself. Errors are clearly spelled out, and you can see the results on queue_log.
Happy tracing!
QueueMetrics References
QueueMetrics software is available for FreePBX, Yeastar S PBX, Grandstream PBX, Issabel, FusionPBX, MiRTA PBX and most Asterisk distros. We offer a concierge service for potential customers, so we will do the integration with you and will walk you through the first steps on QueueMetrics with a free on-line meeting.
For more technical information please refer to the User Manual.
Visit www.queuemetrics.com for a free full featured trial.
Attend our Free Webinars for a live demonstration of QueueMetrics.
keyboard_arrow_left Back