First step with QueueMetrics - Homepage
This guide introduces the User Homepage, and how it differs from the Agent Page. The Agent Page is available by default but is empty; once the appropriate permission keys are assigned, it’s populated with the features the agent needs.
Login.
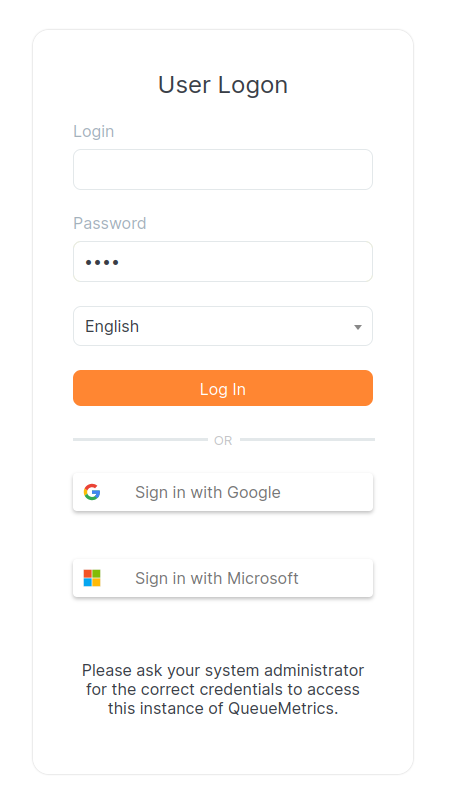
To log on to QueueMetrics, you have to point your browser to the address of the server where you installed QueueMetrics.
You can login with your QueueMetrics user credential, or if SSO is configured, sign in using your Google or Microsoft account.
The User home page
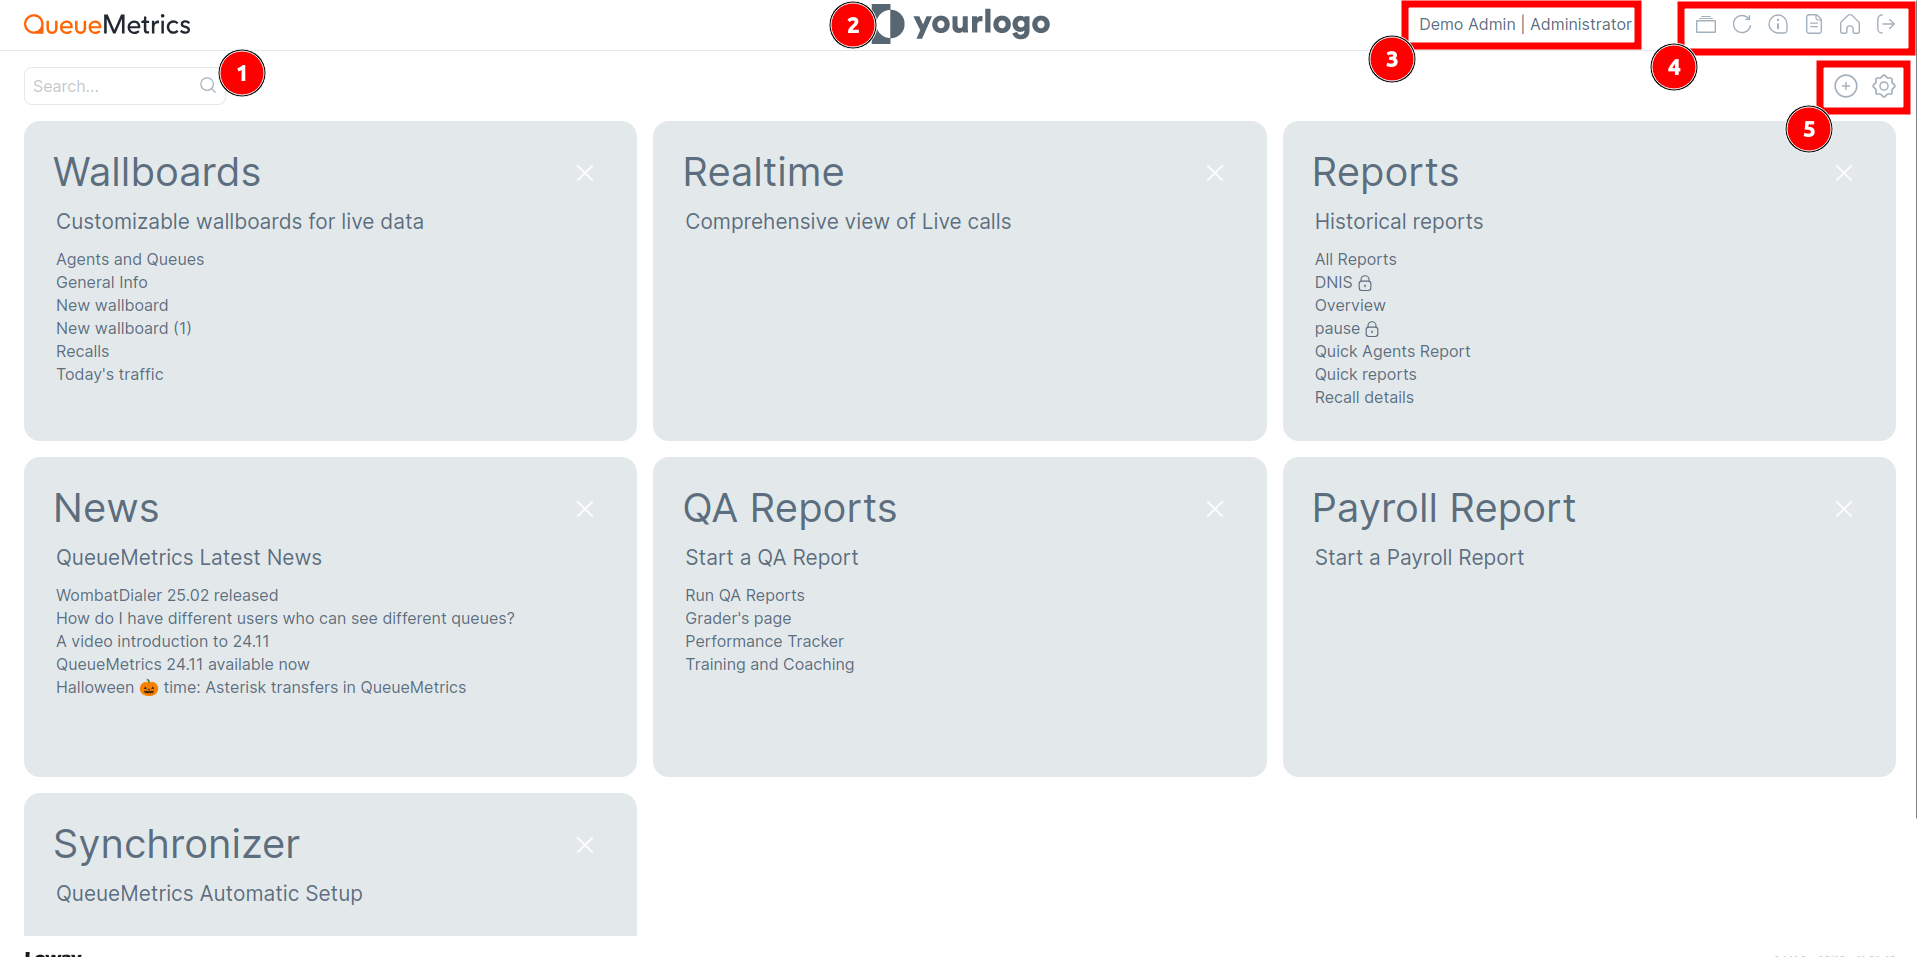
Here we can see:
1. Search field – By typing a query in the search bar at the top of the Home Page, the user can search for specific quick links or QueueMetrics features.
2. Your Logo – To change your logo, edit the system property layout.logo. Its description and usage can be found in Layout and Behavior Preferences.
3. Name of user and role – Here you can see which user is logged in and their role (user, admin, supervisor, etc.).
4. Main Features – Task, Refresh, User Information, License Page, Home, Log Out (explained in the next chapter).
5. Edit InfoBoxes and Settings – Options to customize your homepage view.
Main Features

1. Tasks – Useful for scheduling activities in your call center.
2. Refresh button – Refreshes your page.
3. User Information – Allows you to change the theme and password.
4. License Page – Displays the current software version and license information.
5. Home button – Always returns you to the Homepage.
6. Log Out button – Closes your session and disconnects you from QueueMetrics.
Edit Home page
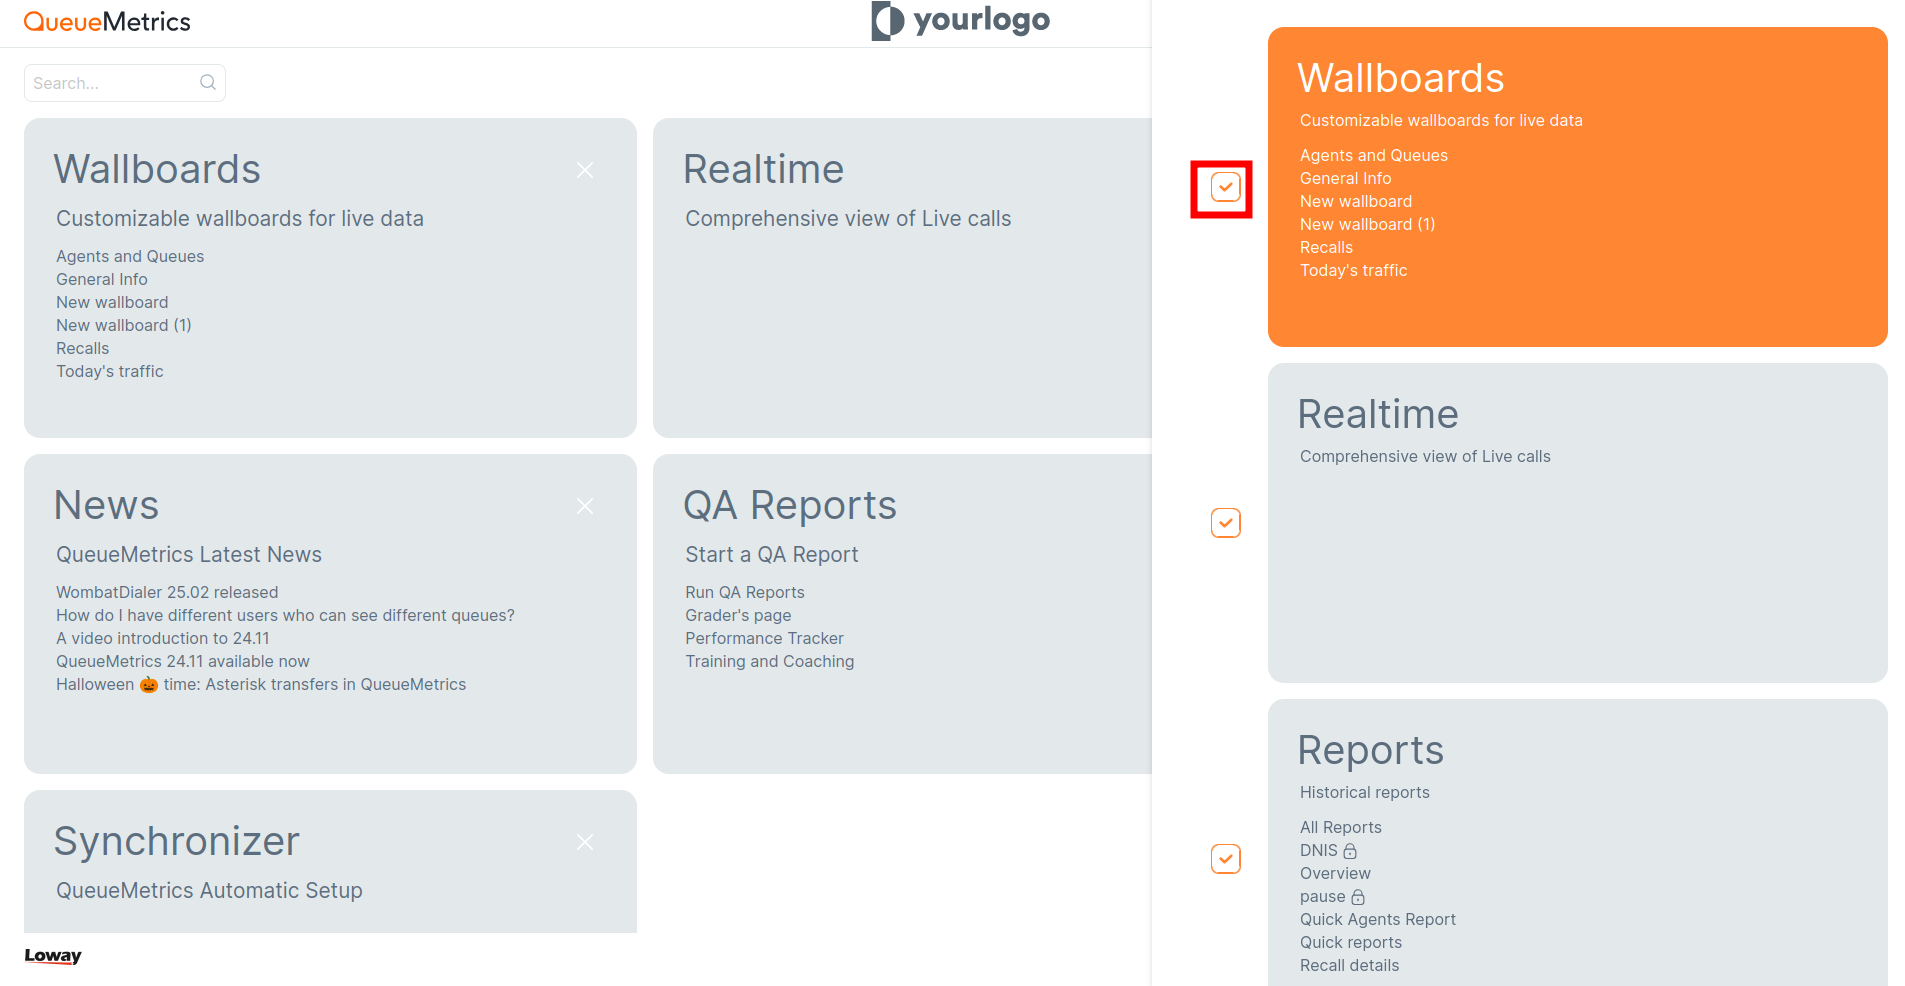
In this menu you can add or remove InfoBoxes:
-
To add new InfoBoxes, click the “+” button in the top-right corner of the Home Page. This opens the InfoBox selector, where you can choose which InfoBoxes to display by flagging them.
-
To remove InfoBoxes, in the same menu, unflag the InfoBoxes you want to remove.
Settings
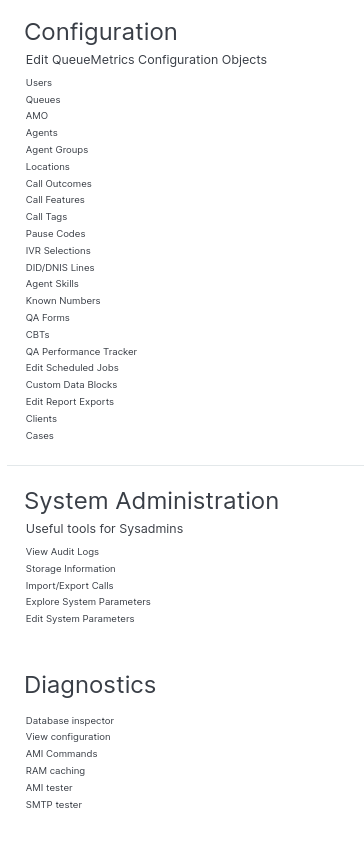
To access the Configuration Editors, System Administration, and System Diagnostics, click the gear icon in the top-right corner. This opens the Administration menu, which shows only the features your account is permitted to use.
The menu is divided into three sections:
-
Configuration - Set up and manage agents, users, queues, and related settings.
-
System Administration - View configuration properties and audit logs, check MySQL storage information.
-
Diagnostics - With the appropriate security keys, access the System Diagnostic Tools: Database Inspector, View Configuration, AMI Command Debugger, RAM cache monitor/reset, AMI connection tester, and SMTP tester.
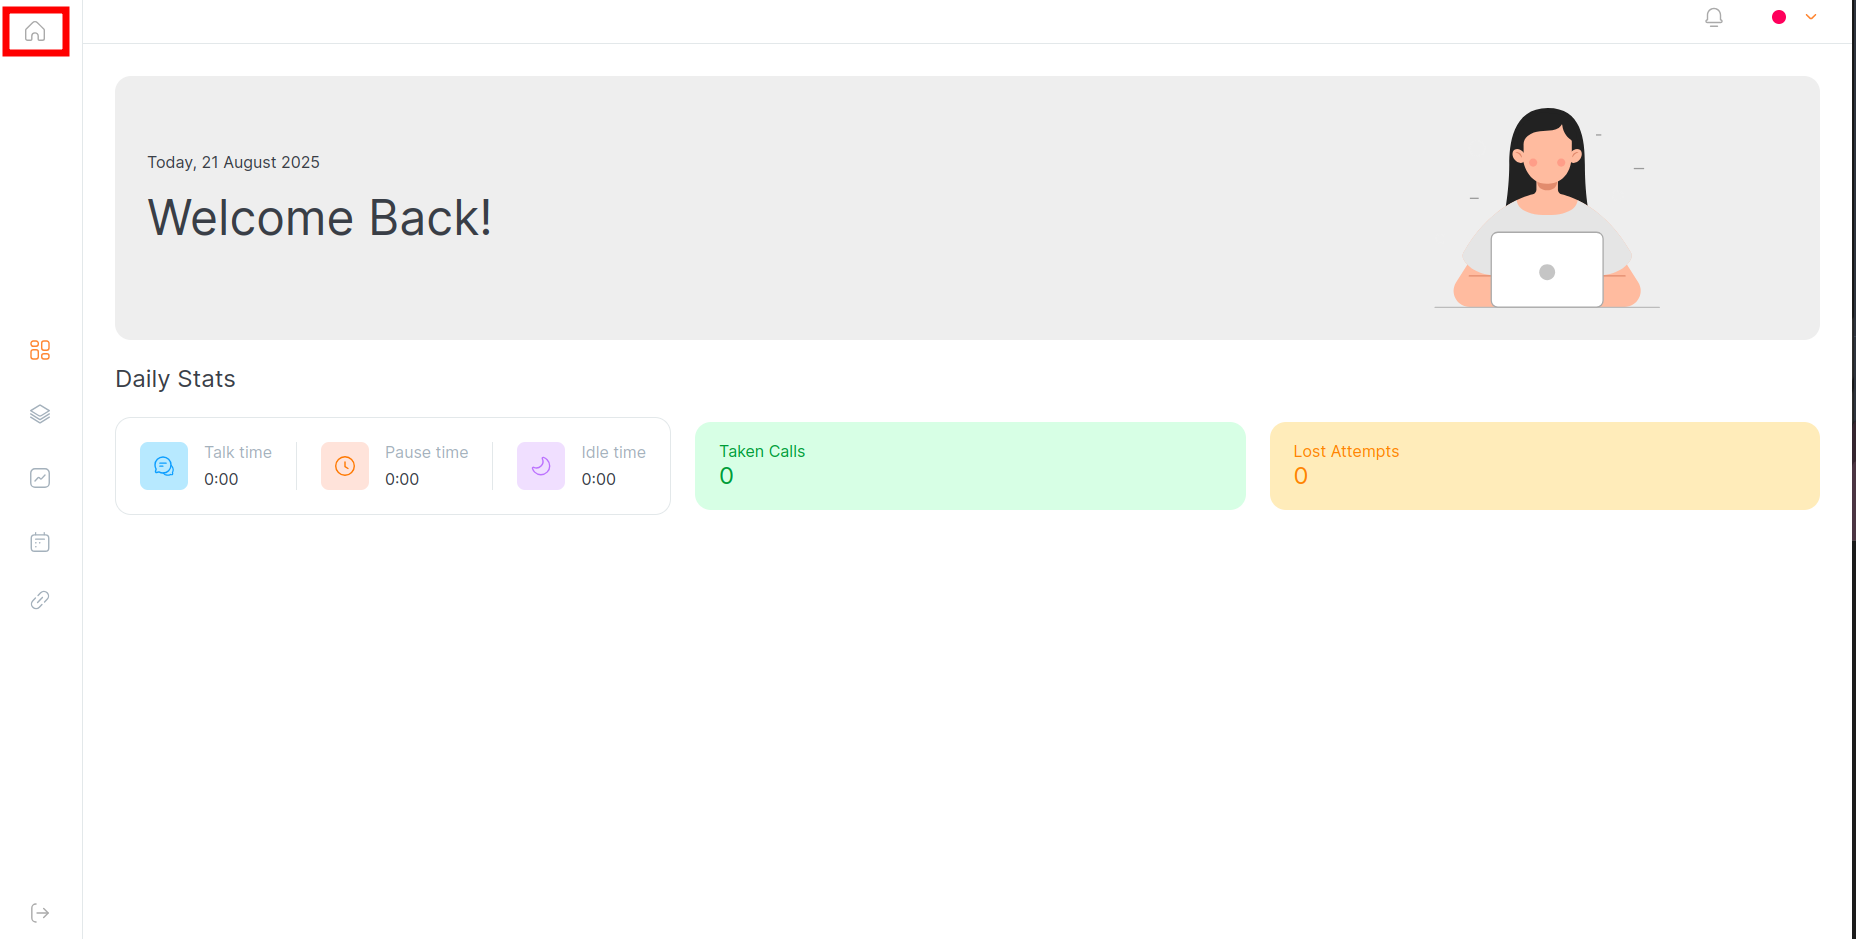
How can an Agent access this page
If you’re an agent, open the Home Page by clicking the Home icon. InfoBoxes are visible only if your account has the required permission keys. If you don’t see them, ask your administrator to assign the appropriate keys to your user.
….
About QueueMetrics
QueueMetrics is a highly scalable monitoring software that lets you track agent productivity, payrolls, measure targets, conversion rates, queues/ACDs, IVRs, music-on-hold, generate outbound campaign statistics and monitor realtime processes with customizable wallboards.
You can measure all activities in your contact center with more than 200 different metrics and manage realtime processes with live alarms and full control on calls and extensions, including whisper, spy and barge modes.
QueueMetrics is available on premise or as a cloud hosted service, and it is compatible with FreePBX, Grandstream, Issabel, MiRTA, Enswitch, Yeastar S PBX, VitalPBX, FusionPBX and many other Asterisk- and Freeswitch-based systems. It also supports Microsoft Teams telephony.
For more technical information please refer to the User Manual.
Visit www.queuemetrics.com for a free 15-day full-featured trial.
keyboard_arrow_left Back