First step with QueueMetrics - Wallboard
This guide will help you set up and use the QueueMetrics Wallboard, a powerful real-time dashboard that displays your contact center metrics through customizable widgets.
The Wallboard
What You’ll Need
The default admin account should have you covered but, if you are not seeing the Wallboards, make sure you have the right permissions:
- REALTIME – Lets you view the Wallboard
- WALLBOARD_ADD – Lets you create and edit Wallboards
- WALLBOARD_FORALL – Lets you create public Wallboards that everyone can see
You can find more details on how User keys work in QueueMetrics Here
Getting Started with the Wallboard
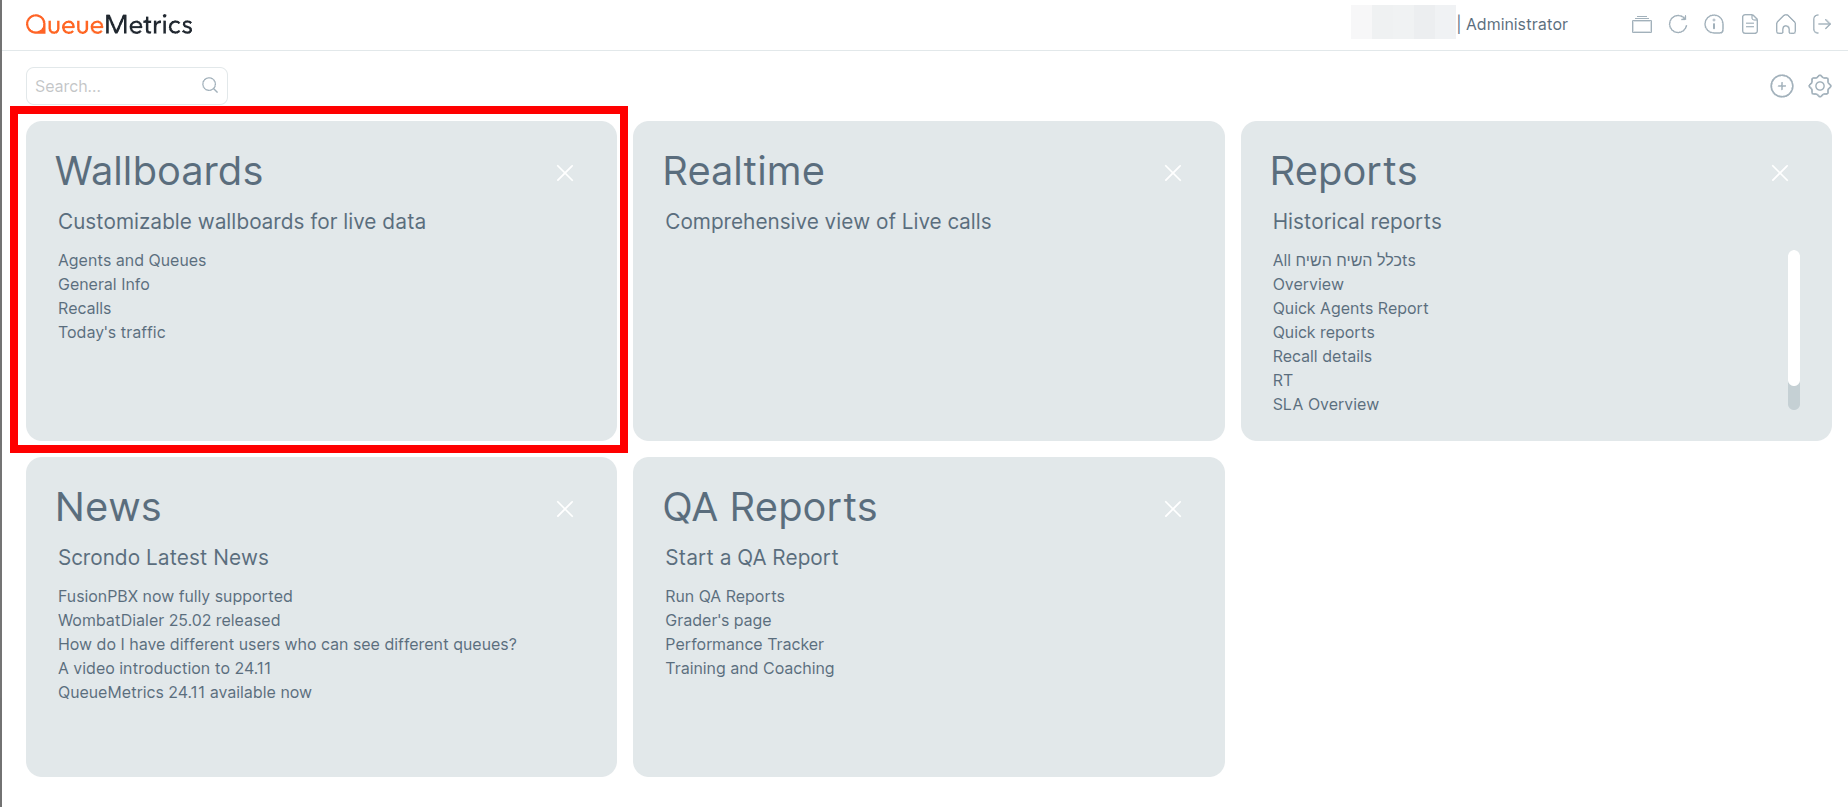
Access the Wallboard from your QueueMetrics home page by clicking the “Wallboard” section:
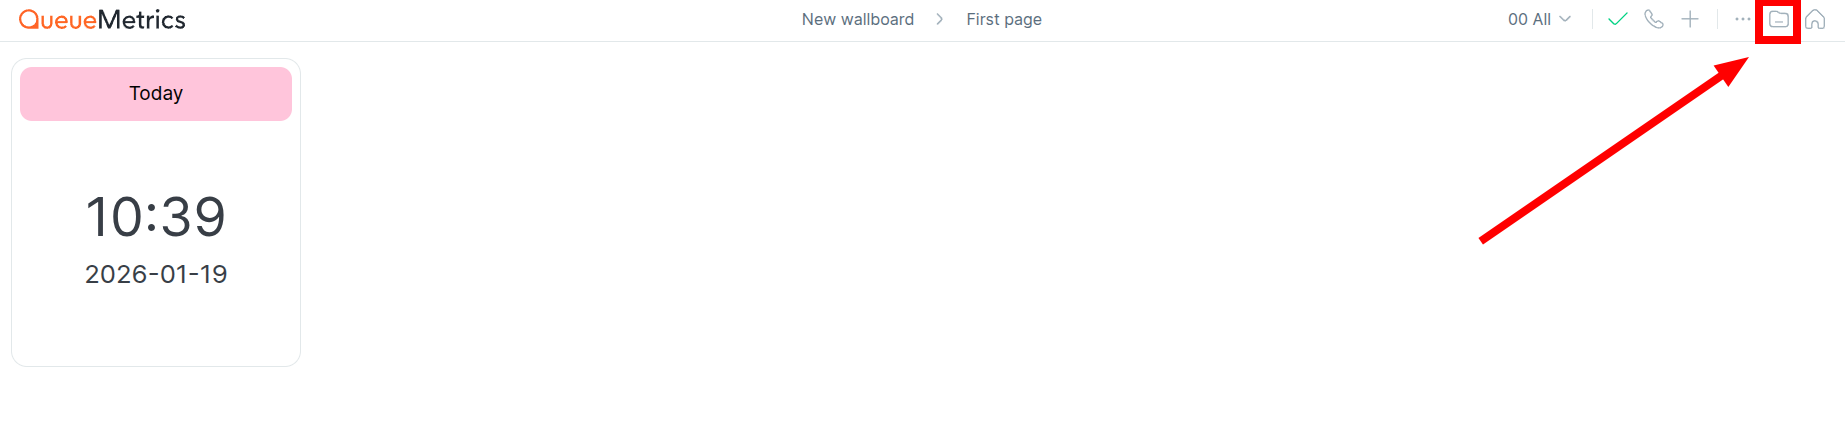
Option 1: Access an existing Wallboard
Step 1. Click the Load button in the top toolbar.
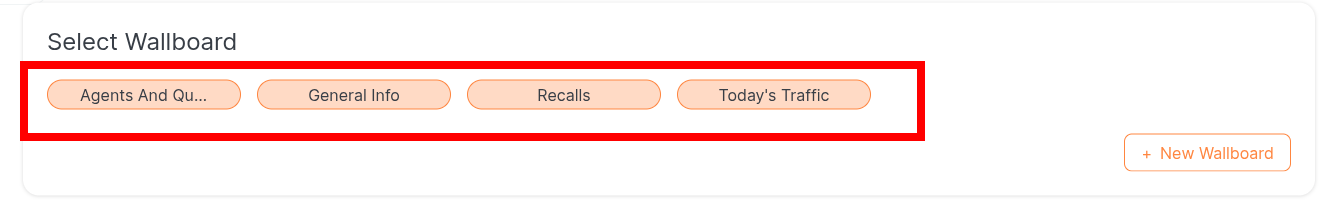
Step 2. You can choose and load an existing Wallboard.
Option 2: Create a New Wallboard
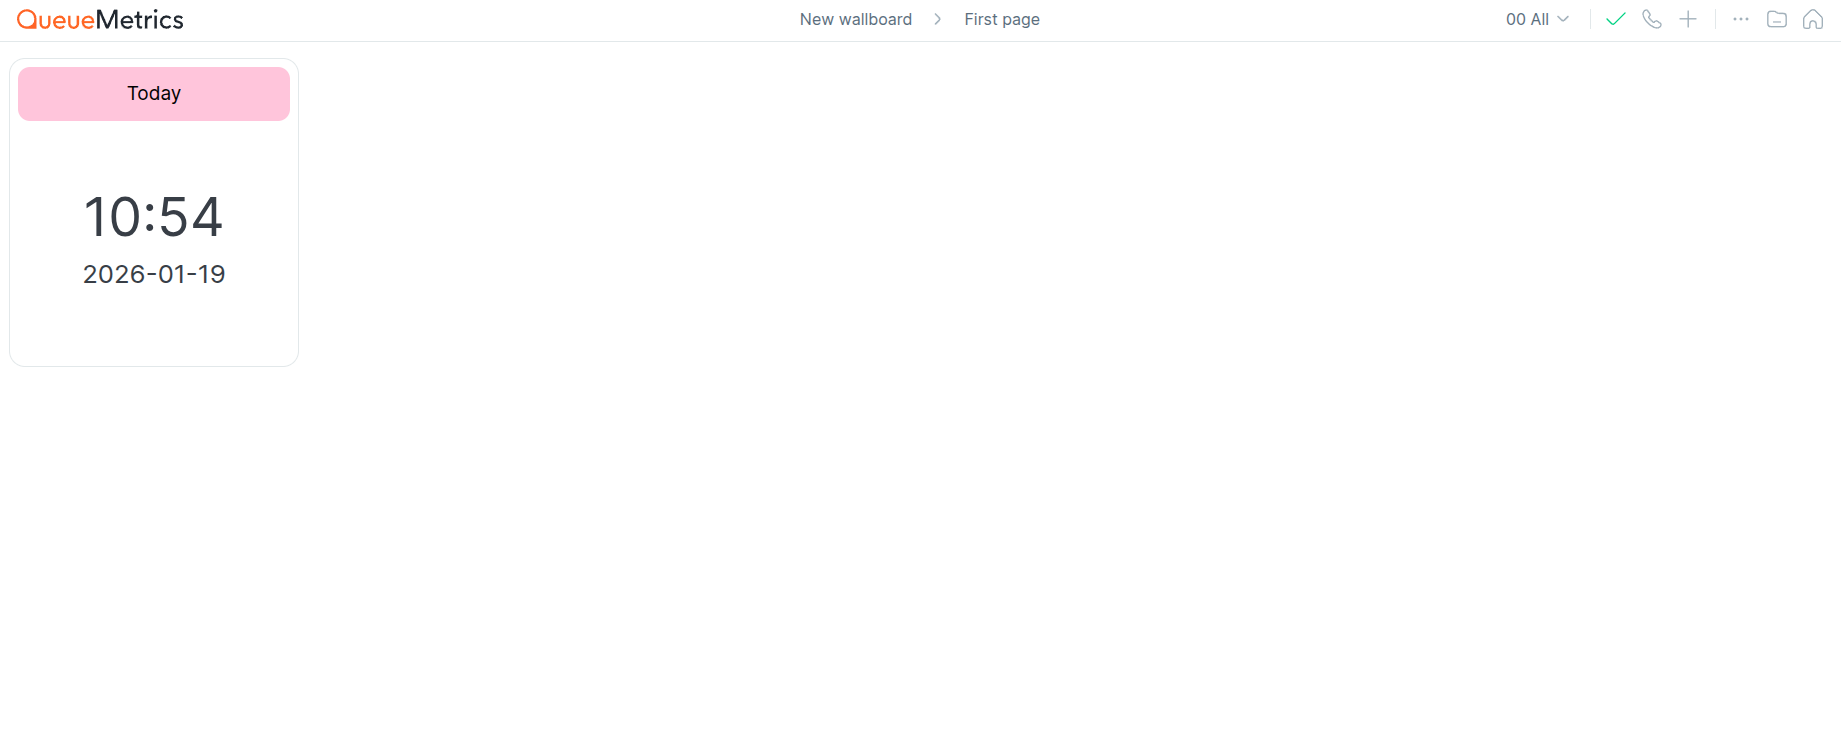
After opening the Wallboard from the Home page, you will see a new, blank Wallboard.
You can fully customize this to suit your specific needs and preferences.
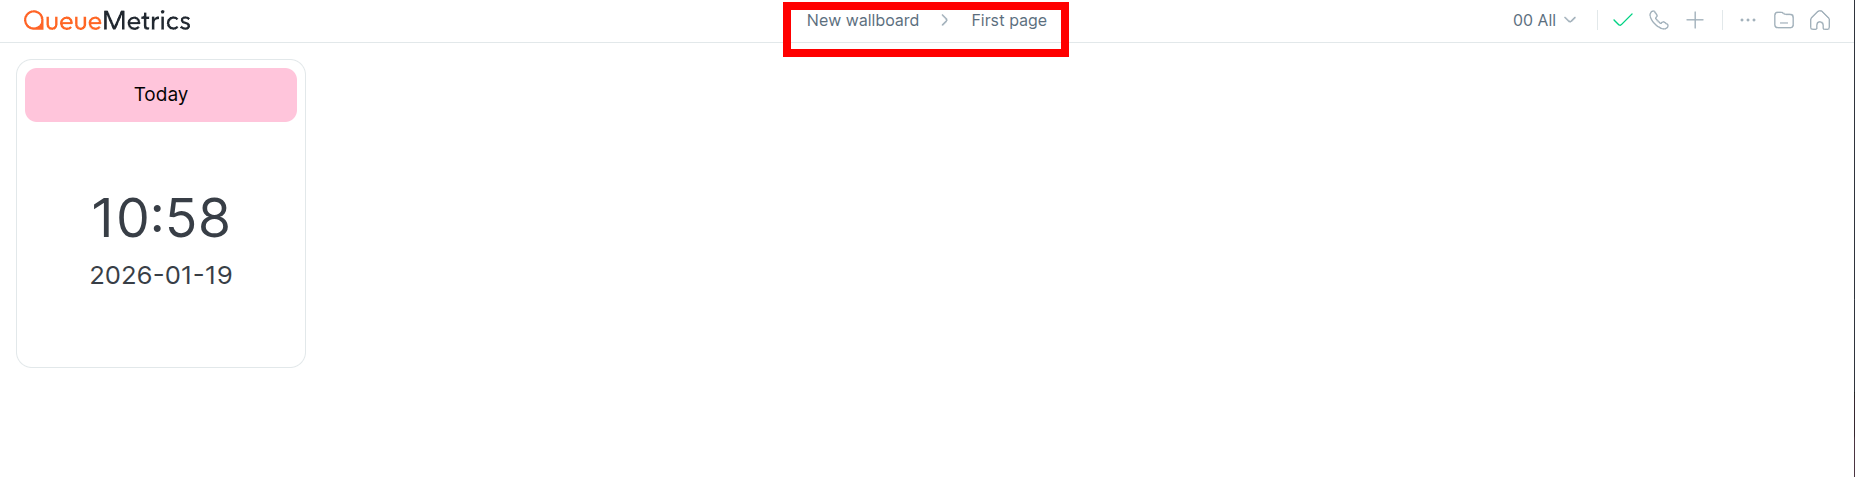
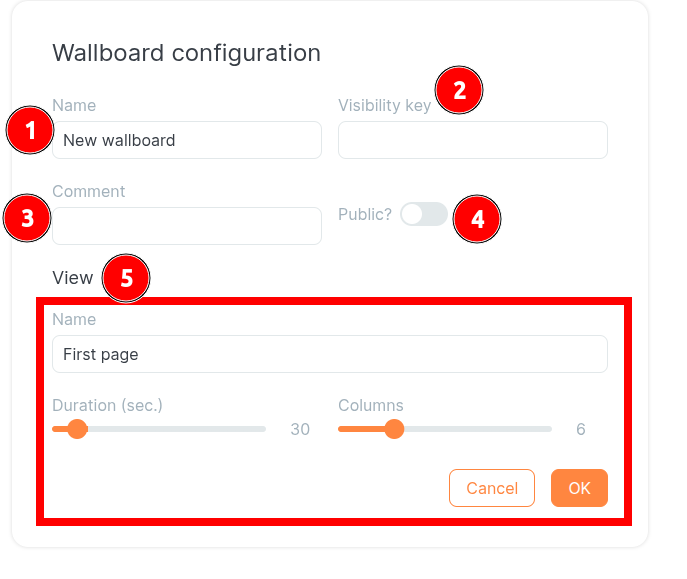
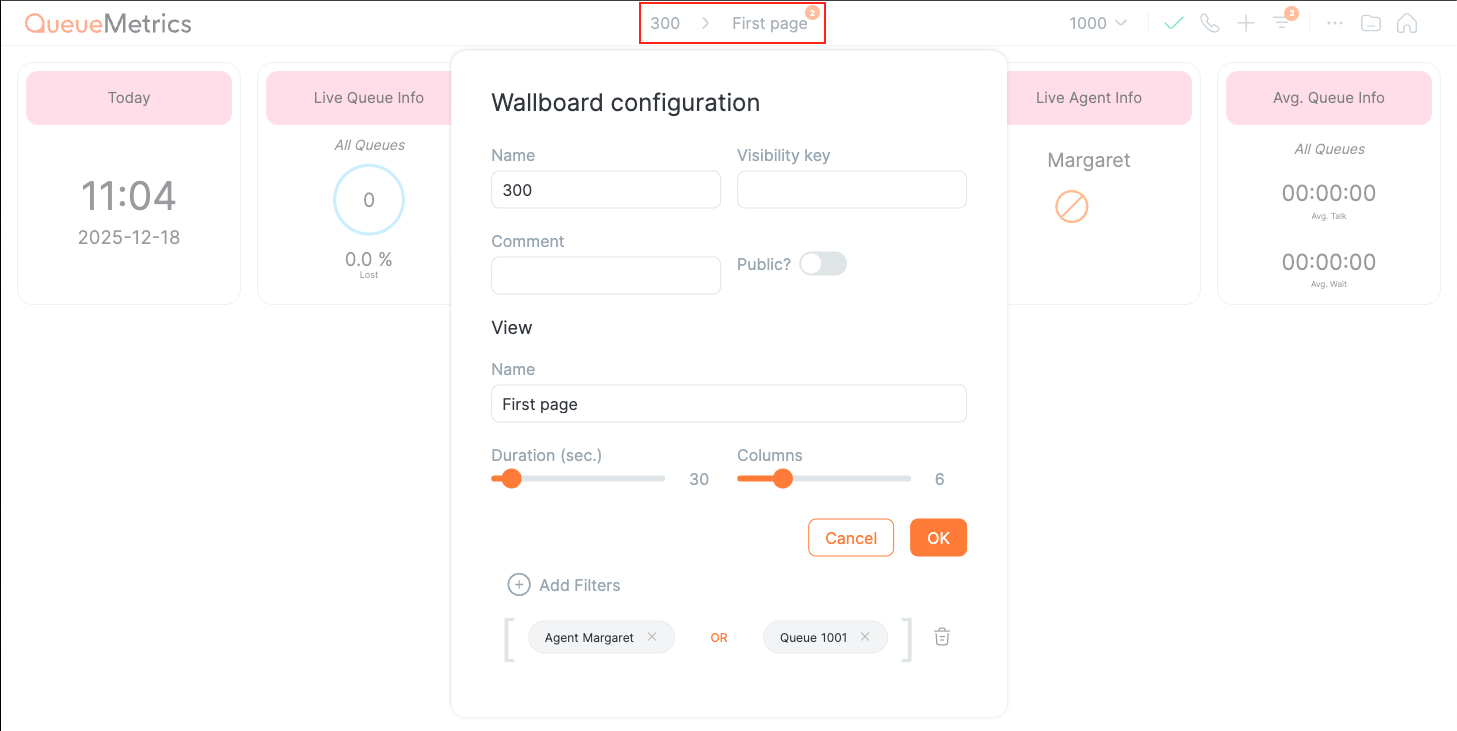
Click the Wallboard title at the top of the screen to access the following options:
-
The Wallboard name.
-
Visibility key of the wallboard.
-
Free text comment you may want to save.
-
Public controls, whether the wallboard appears on every user’s home page.
-
The View section allows you to configure the View Name, Duration, and Column Size.
Widgets
Now that you have configured the general settings, it’s time to display your call center data.
To show real-time information, you can choose from several different widget types.
To add a widget to your Wallboard, simply click the “+” button in the top right corner.
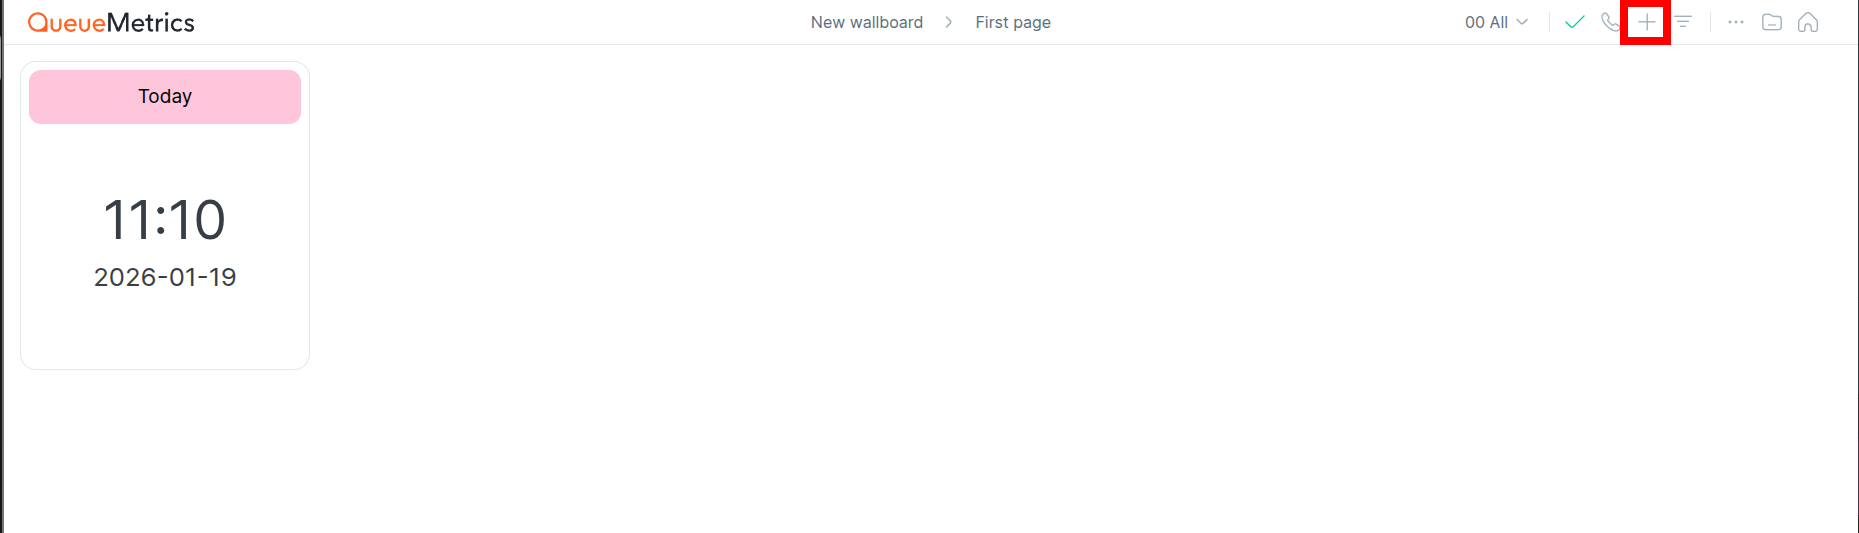
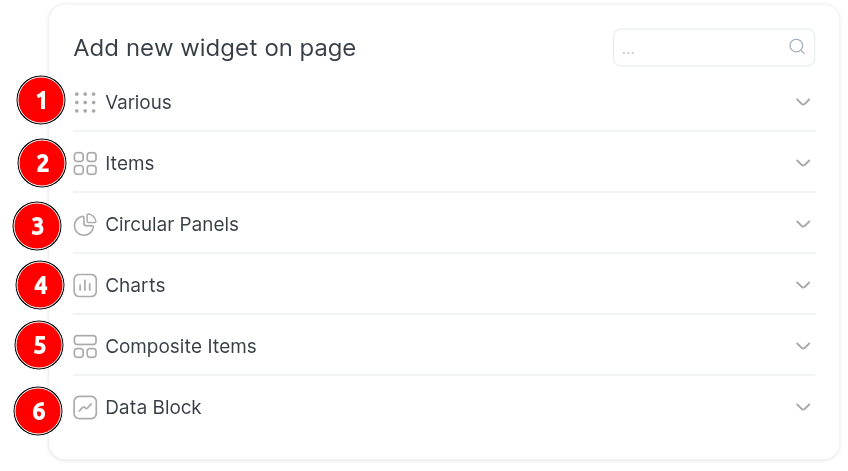
From here, you can choose the type of datablock that best fits the purpose of your wallboard view:
-
Varius:
where you can find the Clock widget (showing the current Date and Time), free text (showing a string of text), or HTML (an Iframe component showing any Web page that allows Iframes to display it) -
Items:
is a compact display providing useful information at a glance, such as Answered Calls, Offered Calls, Longest Wait, and Lost Calls -
Circular Panels:
are another compact widget types that displays useful metrics such as Agents on Call, Agents Ready, Offered Calls, and many more -
Charts:
detailing calls that meet the defined SLA answering time requirements -
Composite Items:
live tables of ongoing queue and agent activity -
Data Block:
more complex charts and graphs with realtime data
Filter
Starting from QueueMetrics 26.01.1, it’s possibile to add a vast variaty of filters.
The wallboard filters are divided in three level:
-
General Wallboard: These filters affect all views and widgets and are accessible via the top bar button.
-
View Level: These filters affect only the widgets within the current view, and are managed through the View Settings.
-
Widget Level: These filters apply exclusively to the selected widget and are accessible via the individual Widget Settings.
The complete documentation here.
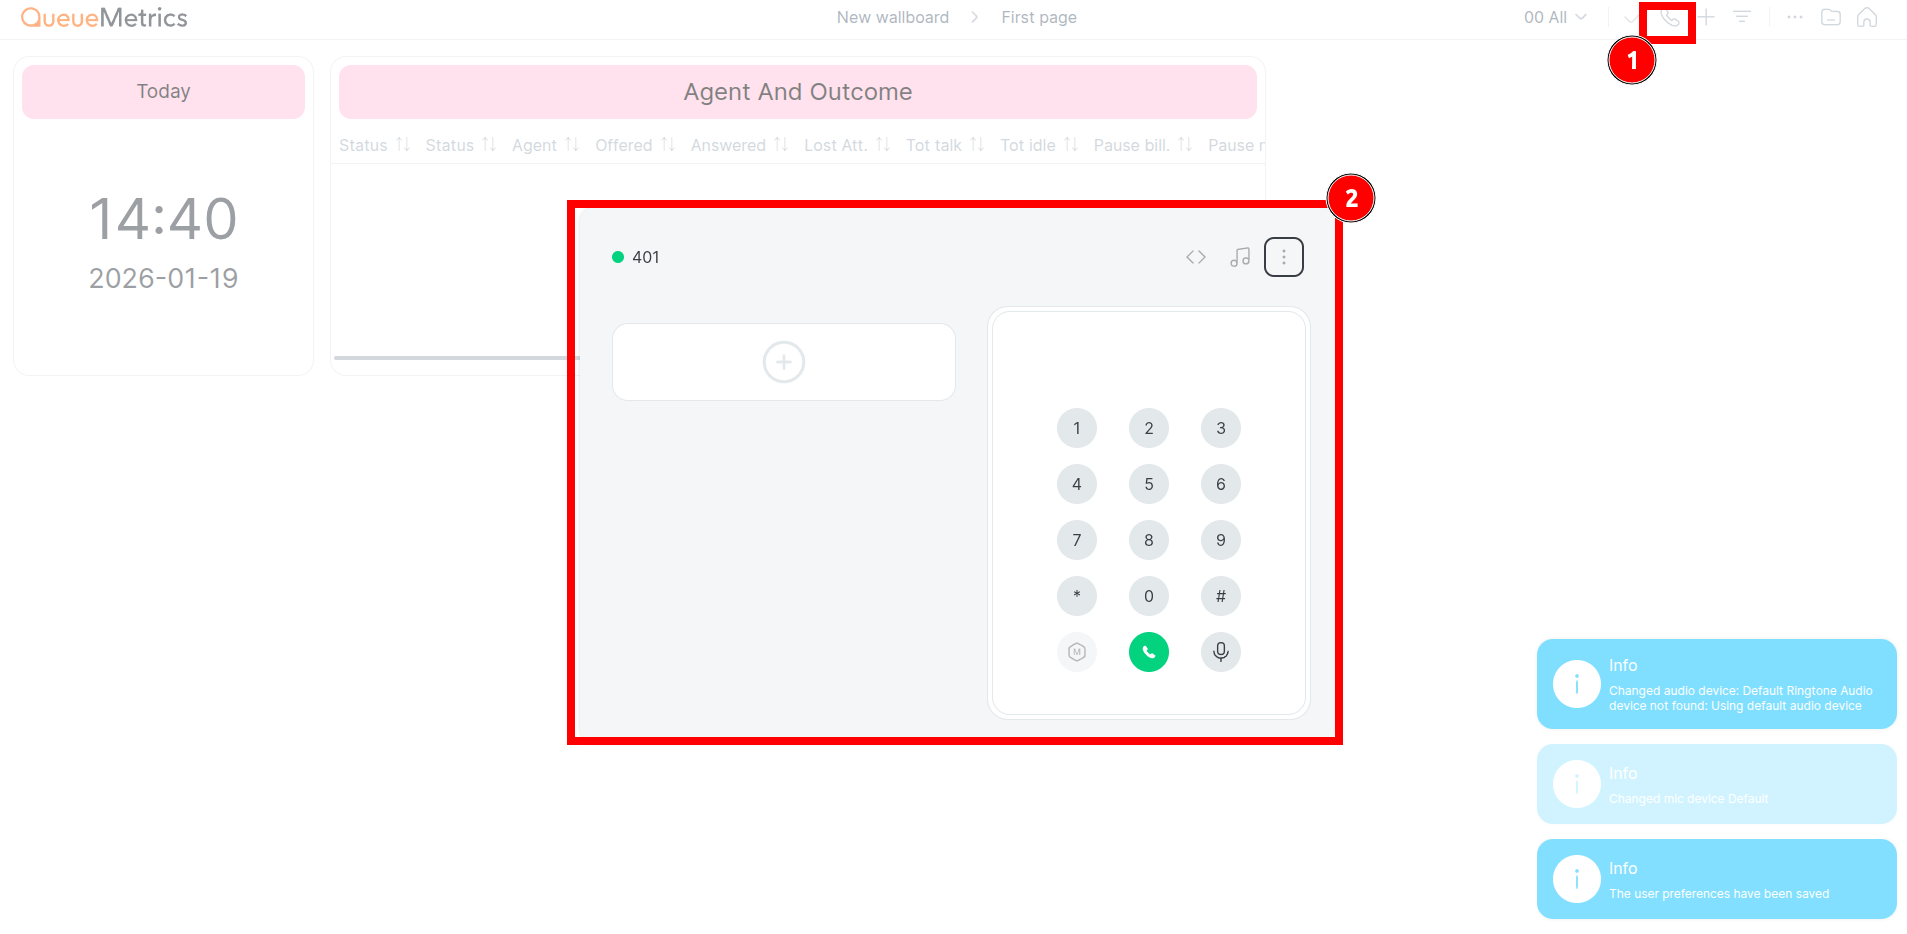
Softphone
The softphone is the tool that allows agents to handle calls directly from the QueueMetrics interface, without using a physical phone.
Through the softphone, agents can answer, hold, transfer, and end calls, as well as change their operational status.
Proper use of the softphone is essential to ensure service continuity and alignment with the data displayed on the wallboard.
To open the actual Softphone Panel, click on the Phone icon in the top bar.
For more information regarding the softphone, you can follow this link.
Agent Actions
Starting with QueueMetrics 26.01, Agent actions have been streamlined for a simpler and more intuitive user experience:
You can now select an agent from the dropdown menu to automatically fill in the required fields. Available actions will change based on the agent’s real-time status:
-
If Not Logged In: You can only add the agent as a member.
-
If Logged In: You can pause or remove the agent.
In this case, QueueMetrics will automatically preselect all queues where the agent is currently active.
You can find more information at this link.
Setting Up Alerts
Visual alerts are your early warning system, they automatically change widget colors when metrics cross important thresholds, helping you spot problems before they escalate.
How Alerts Work:
Think of alerts as traffic lights for your contact center:
Yellow – Warning: approaching your threshold
Red – Critical: threshold exceeded, action needed
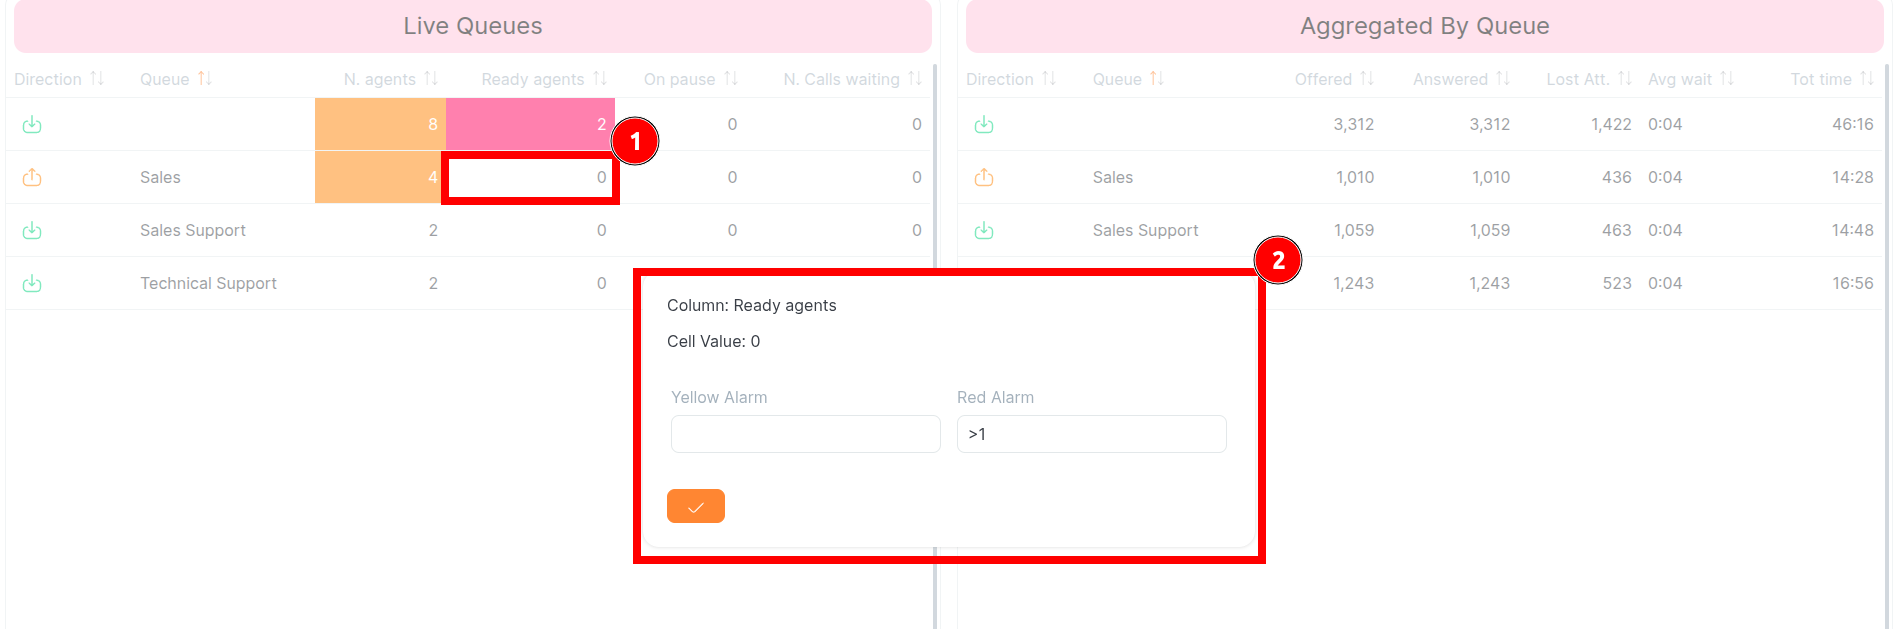
How to create custom alerts
You can set up alerts for any metric displayed in a widget.
Here’s how:
-
Click on the widget table cell where you want to set an alert.
-
Enter your condition using the “<”, “=” or “>” operators.
-
Click on the checkmark button to confirm the changes.
Displaying on Large Screens, the Kiosk Mode
Note: Kiosk mode requires a user with the REALTIME and ROBOT grants. These permissions are already configured for the default Robot user.
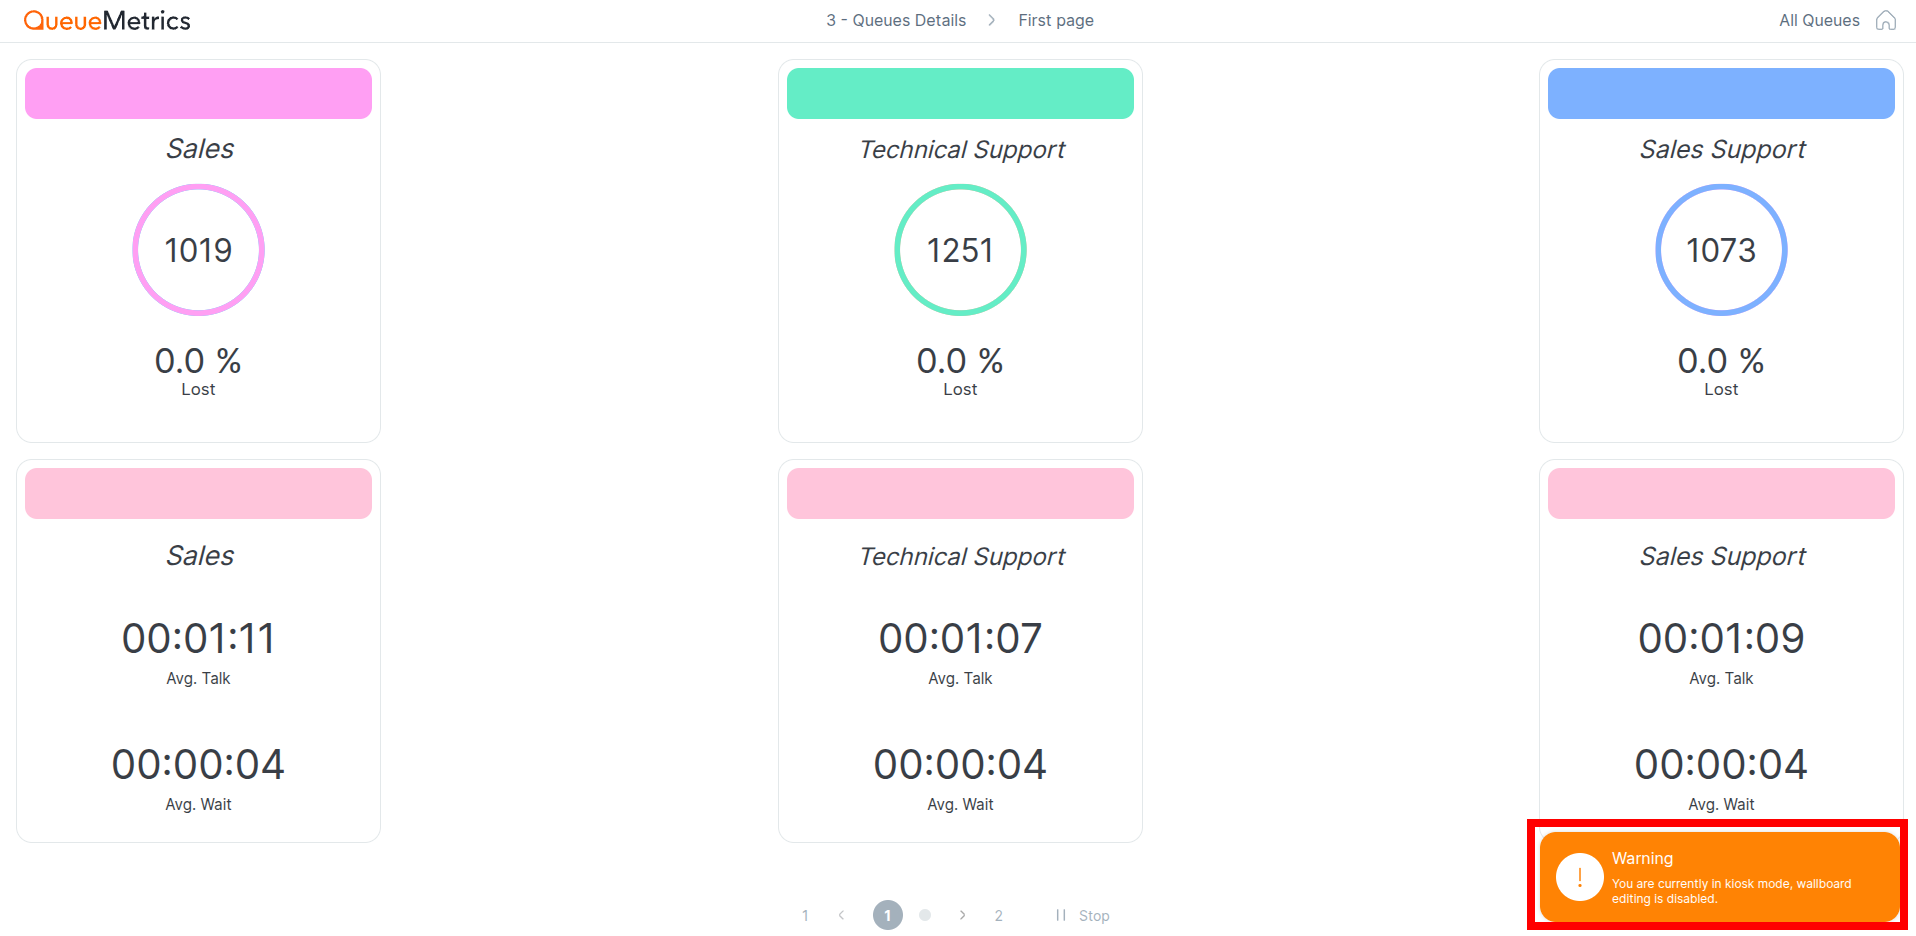
If you connect a low cost Linux device such as a Raspberry Pi or a similar small computer to a large screen or video projector, in your call center, you can display a live wallboard that agents can easily see during the day.
This setup allows you to run a real time dashboard on inexpensive hardware. Once configured, the system requires no interaction other than turning the device on in the morning and off at the end of the day.
You can find full details about configuring and using kiosk mode here.
About QueueMetrics
QueueMetrics is a highly scalable monitoring software that lets you track agent productivity, payrolls, measure targets, conversion rates, queues/ACDs, IVRs, music-on-hold, generate outbound campaign statistics and monitor realtime processes with customizable wallboards.
You can measure all activities in your contact center with more than 200 different metrics and manage realtime processes with live alarms and full control on calls and extensions, including whisper, spy and barge modes.
QueueMetrics is available on premise or as a cloud hosted service, and it is compatible with FreePBX, Grandstream, Issabel, MiRTA, Enswitch, Yeastar S PBX, VitalPBX, FusionPBX and many other Asterisk- and Freeswitch-based systems. It also supports Microsoft Teams telephony.
For more technical information please refer to the User Manual.
Visit www.queuemetrics.com for a free 15-day full-featured trial.
keyboard_arrow_left Back