Useful tools for outbound and IVR tracking

In this tutorial, we will take a look at how to automatically track normal outbound calls with QueueMetrics, using the outbound call tracking feature of the Uniloader service (Unitracker). As well as how to track IVR selections in your contact center.
QueueMetrics
QueueMetrics is a highly scalable monitoring software that lets you track agent productivity, payrolls, measure targets, conversion rates, ACD, IVR, Music on hold, generate outbound campaign statistics and monitor realtime processes with customizable wallboards.
You can measure all contact centre activities with more than 200 different metrics and manage realtime processes with extensions and calls control, live alarms, whisper mode, spy and barge mode.
Configuring the Unitracker
The first task will be to enable the outbound tracking feature by editing the Unitracker configuration file:
/etc/sysconfig/unitracker
Edit the file like this:
LOGFILE=/var/log/asterisk/unitracker.log
LOCKFILE=/var/lock/subsys/unitracker
PIDFILE=/var/run/unitracker.pid

AMIHOST=127.0.0.1
AMIPORT=5038
AMIUSER=cxpanel
AMISECRET=cxmanager*con

#Uncomment to enable event logging
#DEBUGFILE=/var/log/asterisk/unitracker_events.log

#Only MOH tracking is enabled by default
ENABLEMOH=1
ENABLEPARK=0
ENABLEOUTBOUND=1

OUTBOUNDTHRESHOLD=300

# Trunk name, to hide trunk activity
HIDDEN_CHANNELS="^(?i)sip/trunk*|pjsip/trunk*"
These are the parameters that you need to change:
AMIUSER ⇾ add the AMI Username (in this case, we are using the default "cxpanel")
AMISECRET ⇾ add the AMI Password (in this case, we are using the default "cxmanager*con")
ENABLEMOH ⇾ enable Music on Hold tracking (might as well enable this feature)
ENABLEOUTBOUND ⇾ enable Outbound tracking
HIDDEN_CHANNELS ⇾ add the trunk names in place of "trunk", this way we can filter out the trunk "noise"
This is the basic configuration, where ALL the extensions on your PBX will be tracked.
The outbound queue is a bit different from the other queues; it’s a virtual queue (you don’t need to create this queue on your PBX, only in QueueMetrics).
If you don’t want to track all the extensions, you can use Account codes to track the outbound activity of specific extensions on specific queues.
The “issue” with the default “q-outbound” queue, is that it will track all the outbound activity on your PBX.
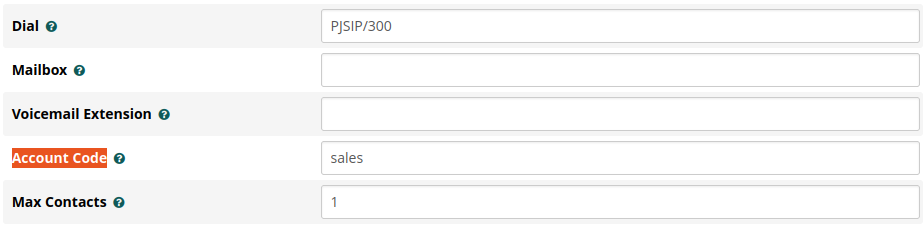
If you want to monitor specific extensions, you will need to add an Account code to each of the extensions you want to monitor (on the PBX side). As an example, you can add to extension 200 the Account code “sales” and to extension 201 the Account code “support”.
To add an account code, simply go to:
Your PBX ⇾ Applications ⇾ Extensions ⇾ Edit an extension ⇾ Advanced ⇾ Account Code ⇾ add "sales"
In QueueMetrics it would be enough to create only the queue “q-sales” to monitor the sales outbound activity.
By default, if an extension does not have an account code, it will be logged on the “q-outbound” queue.
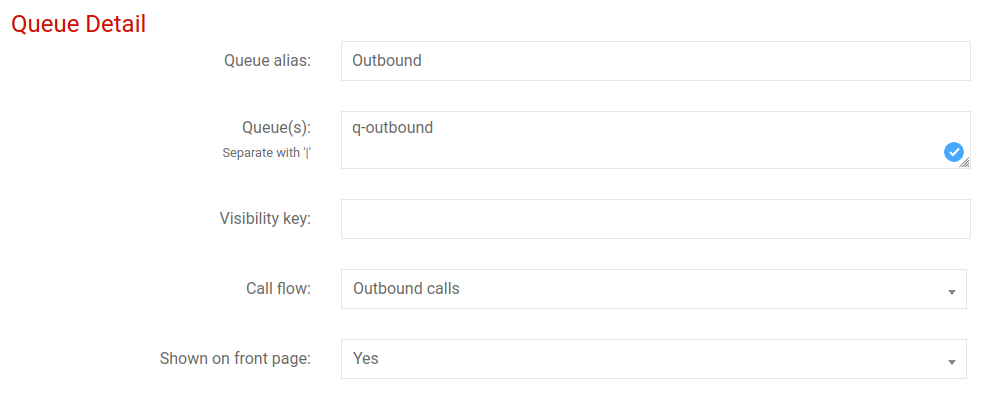
Assuming that we want to track all the outbound activity, we are going to create the “q-outbound” queue, in the QueueMetrics queue configuration page:
QueueMetrics Homepage ⇾ Settings (gear icon in the upper-right corner) ⇾ Queues ⇾ Create New

Queue alias: All outbound
Queue(s): q-outbound
Call flow: Outbound calls
Now back on the PBX server, we need to enable and restart the service:
systemctl enable unitracker
restart
service unitracker restart
IVR Selection tracking
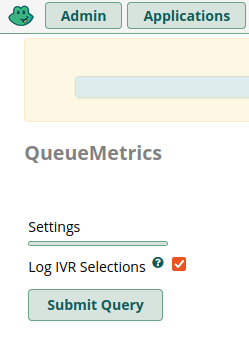
To enable the IVR selection tracking, it is enough to enable the QueueMetrics module on your PBX:
Your PBX ⇾ Setting ⇾ QueueMetrics ⇾ Log IVR Selections ⇾ Submit Query ⇾ Apply Config
NOTE: after applying the configuration on your PBX, the “check mark” icon will disappear from the “Log IVR Selections” box on the PBX. This is normal, the configuration was applied.
If, for whatever reason, the QueueMetrics module is missing from your PBX, you can follow this guide to enable it again:
Enable FreePBX IVR module
Once the module has been enabled, open one of the IVR selections on your FreePBX and grab the IVR ID from the Address bar, ex:
https://FREEPBX_IPADDRESS/admin/config.php?display=ivr&action=edit&id=1
Take note of “id=1”.
Now that the events are being tracked by the PBX, you will start seeing them in the reports as well.
In the logs you will find the events with the tag “IVR-1”, “IVR-2”… depending on what IVR option has been selected.
In our example, IVR-1 (id=1) is the Main Desk.
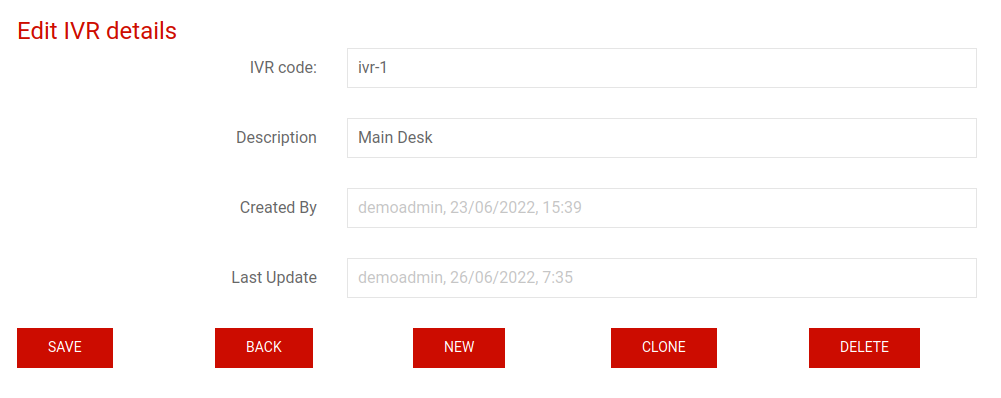
Open QueueMetrics and on your Homepage you will find the “IVR Selections” option, under the Settings category (gear icon in the upper right corner on your Homepage).
In this section, you will be able to define the IVR events, to make them easier to track in the reports.
Create all the IVR events that you need, ex:
IVR code: ivr-1
Description: Main Desk
You will now be able to run a report and see the IVR paths and the digits that have been pressed.
In the next tutorial we are going create a new custom report, and schedule that report to be sent to us, via email, every day at 8:00am:
First custom report and scheduling a report
QueueMetrics References
QueueMetrics software is available on premise or as a cloud hosted service for FreePBX, Yeastar S PBX, Grandstream, Issabel, FusionPBX and many other Asterisk distros.
For more technical information please refer to the User Manual.
Visit www.queuemetrics.com for a free 15 days full-featured trial.
keyboard_arrow_left Back